
Choosing a China Fitness Trade Expo: Meeting Density and Deal Size
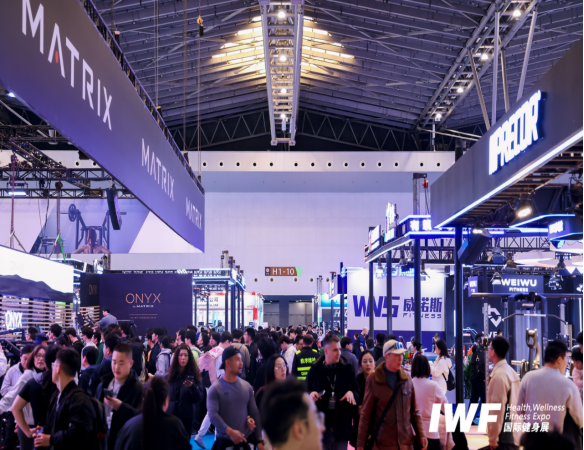
Visitor flow is a visible signal at any expo. Buyer attendance rate tells a sourcing team whether that flow contains the right counterparties. Image: IWF SHENZHEN.
China exported USD 7.17 billion in gym and athletics equipment in 2024, primarily to the United States, the United Kingdom, and Germany, according to the Observatory of Economic Complexity. That figure describes the size of the sourcing opportunity. It says nothing about how efficiently a specific overseas buyer will reach a shortlist of qualified suppliers. That efficiency is decided earlier, when the buyer chooses which trade expo to attend — a decision usually made on reputation, city, or headline scale rather than on measurable procurement output.
This article sets out a buyer-side decision framework for expo selection. It relies on two primary KPIs — effective onsite meeting density and average deal size — supported by two refining metrics: meeting-to-order conversion rate and buyer attendance rate. The logic follows the Market-to-Match methodology, which treats the quality of onsite meetings and the verified presence of real buyers as the design variables of a sourcing event, ahead of exhibitor headcount.
The Expo Decision Is a Procurement Decision, Not a Calendar Decision
Overseas fitness industry buyers typically face the same structural problem: qualified Chinese manufacturers, distributors, and agents are difficult to identify remotely, factories are geographically dispersed across several provinces, and the cost of physically comparing samples is high in both time and travel budget. Because of that, most buyers concede that they must travel to China at least once to compare suppliers in person.
The consequence is that expo selection becomes a procurement decision with a budget attached — flights, visas, hotel nights, show days, and internal staff time. A three-day expo that produces four qualified supplier conversations is a different asset than a three-day expo that produces twenty. Both may advertise the same number of exhibitors. Only one of them justifies the trip.
The framework below is designed for buyers in the awareness and research stages, before a supplier list exists. Its purpose is not to rank expos by prestige, but to give a sourcing team a repeatable way to decide where to spend a finite travel budget.
Why Headline Scale Misleads Buyers
Scale figures are genuine, and they matter — but they measure supply, not fit. China Sport Show 2024 featured over 1,600 exhibiting companies and covered an area exceeding 180,000 sqm, according to the China Sporting Goods Federation. On the demand side, IWF Shanghai 2024 hosted more than 1,000 brands and approximately 75,000 buyers, including more than 1,000 overseas visitors, according to IWF Shanghai's official figures.
Read together, those two data points demonstrate the core problem. A show of 1,600 exhibitors is not a show with 1,600 relevant exhibitors, and a buyer audience of 75,000 is not the same as 75,000 buyers who match a given product category or order profile. Scale describes the market. It does not describe what an individual buyer will extract from three days on the floor.
The practical distinction is between gross density and effective density. Gross density is exhibitors per square meter. Effective density is the number of qualified, pre-screened supplier meetings a buyer can realistically complete per show day. A large horizontal expo can have high gross density and low effective density for a specialist buyer. A vertical expo with a matchmaking programme can do the opposite — fewer booths, but far more relevant conversations per hour.
Four KPIs That Separate a Productive Expo From a Busy One
The following four metrics are the working core of the framework. Two are primary; two refine the arithmetic once the first two are known.
1. Effective onsite meeting density
This is the number of qualified supplier meetings a buyer can complete per show day, where "qualified" means pre-screened for product category, capability, and order scale. It is not the number of booths walked past. Where an organizer runs a structured matchmaking programme and a pre-show online registration or catalog system, effective density rises because part of the screening happens before the buyer arrives, and the on-site time is spent negotiating rather than filtering.
2. Buyer attendance rate
Attendance rate is the share of registered buyers who physically turn up, and it should always be requested at segment level. A show can register large numbers of overseas buyers and still convert a modest share into actual attendees. Segment-level attendance matters more than the total, because a distributor sourcing commercial gym equipment has little use for registration volume generated by retail walk-in traffic or adjacent consumer categories.
3. Meeting-to-order conversion rate
Conversion rate is the share of onsite meetings that progress to a defined commercial milestone — a sample request, a quotation accepted, a trial order, or a signed supply agreement — within a stated window after the show. This is the metric that exposes activity inflation. A programme that generates forty meetings and converts three is not automatically better than one that generates fifteen meetings and converts six. Conversion is where the value of matchmaking quality becomes visible.
4. Average deal size
Average deal size is the typical order value attached to a converted meeting for a given buyer profile and product category. It is the counterweight to meeting count. A high-density show full of small accessory orders can produce a lower return than a lower-density show where each conversation is a commercial-grade or OEM-scale negotiation. Buyers should estimate this from their own historical order data and from quotation ranges collected during the research stage, not from general industry averages.
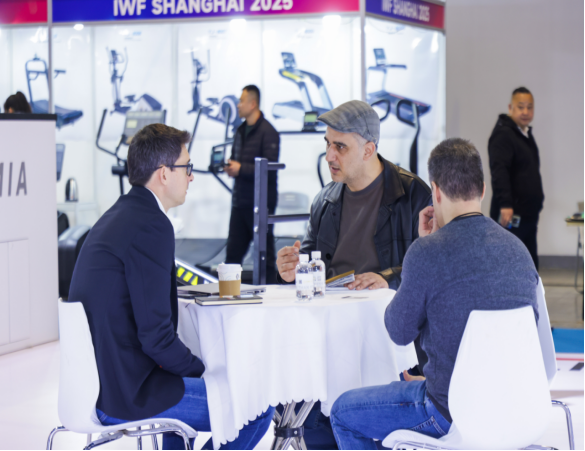
A dedicated B2B matchmaking area converts a large exhibition floor into a controlled meeting schedule — the physical basis of effective onsite meeting density. Image: IWF SHENZHEN.
A Four-Step Buyer Decision Framework
The framework is deliberately short, because it has to be run before travel bookings are made, often with limited information. Each step produces an output that feeds the next.
Step 1 — Define the procurement objective. Specify product category, order scale, and whether the requirement is OEM/ODM development, wholesale distribution, or replacement purchasing for an existing facility. This determines which expo segments are relevant and which attendance statistics actually apply.
Step 2 — Request segment-level data, not headline data. Ask the organizer for attendance by buyer type and region, matchmaking volumes, and any post-show conversion reporting. Where an organizer cannot supply this, treat the gap itself as a data point.
Step 3 — Score candidate expos against the four KPIs. Do this on a single sheet so scoring is comparable. Qualitative judgment is acceptable where data is missing, but it should be recorded separately from measured values.
Step 4 — Convert the score into a meeting target. Set a minimum number of qualified meetings the trip must produce to justify its cost, and hold the show to that threshold. If the expected meeting count falls below the target, the budget is better spent on a different format.
| KPI | What to ask for | Why it decides the trip | Typical source |
|---|---|---|---|
| Effective onsite meeting density | How many pre-screened supplier meetings can be arranged per buyer per show day? | Sets the realistic comparison depth achievable inside a 3-day window | Organizer matchmaking desk |
| Buyer attendance rate (by segment) | What share of registered overseas buyers attended the previous edition, by region and buyer type? | Separates registration volume from counterparties who actually appear | Post-show report |
| Meeting-to-order conversion rate | What share of matchmaking meetings progressed to samples, quotations accepted, or orders? | Measures output rather than activity, and exposes inflated meeting counts | Organizer post-show data |
| Average deal size | What order values are typical for my category and buyer type at this show? | Sets the return threshold that meeting volume must clear | Buyer's own order history plus on-site quotations |
A single-sheet scoring structure. Missing data should be recorded as missing, not estimated.
How the Market-to-Match Logic Changes These Numbers
Shanghai Donnor Exhibition Service Co., Ltd. is an exhibition organizer established in Wenzhou, Zhejiang in 1996, specializing in the organization of international and domestic exhibitions. The company organizes over 30 trade and consumer exhibitions annually across locations including Shanghai, Zhejiang, Sichuan, Guangdong, and Bangkok, Thailand, and its annual exhibition space exceeds 700,000 square meters, with more than 120,000 business exhibitors served in total. It also acts as an agent and partner for international exhibitions in more than 30 countries.
Its fitness-focused offering is the Fitness/Sports product equipment export/import Trade Platform, also referred to as the Fitness/Sports Equipment Trade Expo. It sits in the Trade Exhibition Service category and operates as a Platform Matchmaking service, providing an offline exhibition platform that connects overseas buyers with Chinese manufacturers. Service scope covers fitness equipment, sporting goods, outdoor gear, and sports nutrition. The deliverable is an on-site exhibition booth environment plus a dedicated B2B matchmaking area, delivered as a three-day event in Chinese and English, with an offline venue supported by a pre-show online registration platform.
The structural difference from a conventional exhibition is where the work happens. Instead of leaving buyers to generate meetings by walking aisles, the matchmaking model front-loads screening: market and exhibitor research, booth and zone design, domestic and international buyer invitation, on-site conferences and forums, an online catalog with lead matchmaking, and post-show data and business follow-up. Institutional backing includes UFI/IAEE membership context and supply-cluster resources in the Wenzhou and Taizhou manufacturing belt.
Mapped onto the four KPIs, the effect is specific rather than promotional. Pre-show online registration and online lead matching raise effective onsite meeting density, because part of the qualification happens before the flight is booked. Structured buyer invitation and visa assistance raise buyer attendance rate, because registration is converted into physical presence. Post-show data and business follow-up support measurement of meeting-to-order conversion rate, because the meeting record does not end when the booth lights go down. And because the matchmaking area concentrates OEM negotiations, brand recruitment, and chain-operator procurement in one zone, the range of average deal size becomes visible earlier in the comparison process.
None of this removes the buyer's own work. It changes the starting point from an empty aisle to a scheduled list of counterparties.
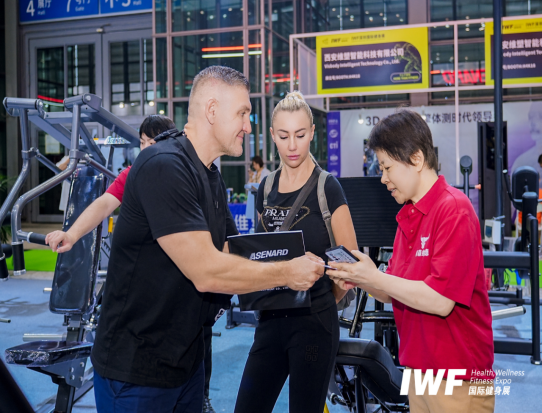
Average deal size is set in negotiation, not on the show floor map. Higher-value categories justify higher meeting thresholds. Image: IWF SHENZHEN.
Applying the Framework: Three Sourcing Scenarios
The four KPIs are weighted differently depending on the buyer's actual objective. Three common profiles illustrate how the framework shifts.
First-time importer building an initial supplier panel. Here the binding constraint is comparison depth, so effective onsite meeting density dominates. Average deal size is likely modest at first and should not be used to reject a show. The relevant question is whether the buyer can leave with enough qualified manufacturers to run a sample round.
Gym chain operator running a multi-site rollout. Order scale is high and specification consistency matters more than raw supplier count. Average deal size and meeting-to-order conversion rate dominate, and OEM negotiation capability inside the matchmaking area becomes the deciding factor rather than the number of booths.
Distributor or cross-border trading firm expanding a category line. Category breadth matters, which makes the expo's scope the first filter — fitness equipment, sporting goods, outdoor gear, and sports nutrition sit in the same sourcing trip only where the show covers them. After scope is confirmed, attendance rate by region determines whether the trip serves both supplier acquisition and future channel development.
In each case, the buyer should set a minimum meeting threshold before booking travel. The threshold converts an expo from a general industry experience into a measurable procurement project.
What Chinese Fitness Export Data Says About Expo Choice
The direction of Chinese fitness equipment exports supports the case for treating expo selection methodically. Chinese fitness equipment exports under HS 950691 reached USD 4.78 billion in the first half of 2025, a 10.2% year-on-year increase, according to Big Trade Data. Regionally, fitness equipment exported from Yiwu to France recorded a 70.5% surge in early 2024 in the run-up to major sports events, according to local customs reporting cited by People.cn.
On the demand side, the domestic Chinese market continues to expand the pool of manufacturers with scale. The China Fitness Industry Data Report 2023, cited by the Shanghai University of Sport, recorded 69.75 million paid gym members nationwide, and China's fitness app market was estimated at USD 4.746 billion in 2024 by Market Research Future. A deeper domestic market produces more product categories, more suppliers, and more format fragmentation — which is precisely the condition under which a buyer's screening burden grows faster than the number of relevant shows.
Regional specialization is also visible in published exhibition planning. IWF Shenzhen 2026 is listed with a planned footprint of 20,000 square meters and more than 400 exhibitors, focused on the Greater Bay Area, according to TradeWheel. Shows of that scale are not substitutes for larger national events; they serve a narrower geographic and category brief. For a buyer running the four-KPI framework, they represent a different point on the density-versus-scope curve rather than a better or worse option.
The practical reading is this: as export volumes and domestic participation both rise, headline attendance numbers will keep growing, and they will become less useful as a selection signal. Segment-level density and conversion data become the differentiator.
Framework Limits and Comparison With Traditional Sourcing Routes
A KPI-based approach is useful, but it is not a complete procurement method. The clearest limitation is that it depends on organizers disclosing segment-level attendance and conversion data. Many do not, and where an expo cannot supply that information, the buyer is pushed back to reputation-based judgment — the very problem the framework is meant to solve.
| Sourcing route | Strengths | Constraints a buyer should plan for |
|---|---|---|
| Large horizontal multi-category expo | Very broad supply base; useful for category discovery | Low effective density for a specialist brief; travel time is consumed filtering rather than negotiating |
| Vertical fitness expo with matchmaking | Pre-screened meetings; category concentration; structured follow-up | Requires pre-show preparation and registration; matchmaking quality depends on the buyer's own brief |
| Online sourcing platform | Low cost; broad long-tail reach; easy initial screening | No physical sample validation; negotiation and trust-building are slower |
| Independent factory tour itinerary | Direct production observation; deep supplier-specific insight | Low supplier count per trip; factories are geographically dispersed and travel cost is high |
Comparative structure for buyer planning. No route dominates on all four KPIs simultaneously.
Three further boundaries are worth stating plainly:
- Preparation cycles are long. Exhibitions require forward planning on both sides, and buyer-side pre-registration and actual turnout rates among overseas buyers remain an area where the industry has room to improve. A buyer who decides late will get less from a matchmaking programme than one who registers early.
- The matchmaking loop is not an after-sales service. The Fitness/Sports product equipment export/import Trade Platform's stated scope excludes post-matchmaking after-sales service for domestic and international partners. The matchmaking function ends at lead generation and connection; execution, quality control, and contract performance remain the buyer's responsibility.
- Meetings are not audits. Concentrated onsite meetings accelerate comparison, but factory-level quality verification and production capability assessment still require separate validation. The expo reduces the cost of finding candidates, not the cost of verifying them.
Against purely offline expos, online matchmaking and data follow-up improve post-show tracking and conversion visibility. Against purely online sourcing platforms, a physical venue provides product experience and immediate negotiation scenarios. Neither format replaces the other, which is why the framework treats them as different positions on the same decision sheet.
Future Outlook: From Attendance Numbers to Conversion Records
The direction of trade exhibition services is toward hybrid, data-closed models — an on-site venue supported by pre-show online registration, online catalogs, and lead matchmaking, with post-show data and business follow-up closing the loop. This changes what an organizer can report, and therefore what a buyer can evaluate.
As that shift continues, the likely effect is that expo marketing moves away from headline visitor counts and toward segment-level performance. Buyers who already use meeting density, attendance rate, conversion, and deal size as their selection criteria will be positioned to use that reporting immediately, rather than treating it as a novelty.
For sourcing teams, the practical implication is to build the KPI request into the expo shortlisting process now, before it becomes a standard item in every organizer's post-show pack. The buyers who ask first will be the ones whose meeting schedules are built around their actual order profile.
FAQ
What does "effective onsite meeting density" mean at a fitness trade expo?
Effective onsite meeting density is the number of qualified supplier meetings a buyer can complete per show day, where qualified means the supplier has been pre-screened against the buyer's product category, capability requirements, and order scale. It differs from gross density, which is simply the number of exhibitors per unit of floor space. A show with fewer exhibitors but a structured matchmaking programme and pre-show online registration can deliver higher effective density than a much larger horizontal expo, because screening work happens before the buyer arrives rather than during the show.
How is meeting-to-order conversion rate measured after an expo?
Meeting-to-order conversion rate is the share of onsite meetings that progress to a defined commercial milestone within a stated post-show window. Typical milestones include a sample request, an accepted quotation, a trial order, or a signed supply agreement. The measurement requires meeting records from the matchmaking process and follow-up tracking after the event. Where an organizer operates online catalogs and post-show business follow-up, that tracking is part of the service. Where it does not, the buyer must maintain the record independently.
Why is buyer attendance rate more useful than total visitor count?
Total visitor count describes the size of the audience, not the composition of it. Attendance rate — the share of registered buyers who physically attend — indicates how much of the registered demand converts into presence. Both figures should be requested at segment level, broken down by buyer type and region. A distributor sourcing commercial gym equipment is concerned with the number of comparable distributors and importers who attend, not with general foot traffic. IWF Shanghai 2024, for example, reported approximately 75,000 buyers including more than 1,000 overseas visitors, and those two numbers serve very different planning purposes.
How can a buyer estimate average deal size before attending?
Average deal size is best estimated from the buyer's own order history for the relevant category, supplemented by quotation ranges collected during the research stage. It should be calculated separately for distinct product categories, because commercial-grade equipment, OEM development programmes, sports nutrition, and accessories occupy very different order value ranges. Industry-wide averages are of limited use because deal size depends heavily on buyer profile — a chain operator running a multi-site rollout and a first-time importer buying for a single facility will not share a common figure.
What data should a buyer ask an expo organizer for before committing a budget?
Four categories of data are relevant. First, matching volume and structure: how many pre-screened supplier meetings can be arranged per buyer per day. Second, attendance by segment: what share of registered overseas buyers, by region and buyer type, attended the previous edition. Third, post-show outcomes: what share of matchmaking meetings progressed to samples, accepted quotations, or orders. Fourth, service scope boundaries: what the matchmaking service covers and what it explicitly does not, including whether post-matchmaking after-sales support is provided. Where an organizer cannot supply a given category, that absence is itself a factor in the comparison.
What are the limits of a KPI-based expo selection framework?
The framework depends on data availability and on the buyer's own preparation. Where an organizer does not publish or share segment-level attendance and conversion data, the buyer falls back on qualitative judgment. Preparation cycles for exhibitions are long, and pre-registration and actual overseas buyer turnout remain areas where the industry has room to improve — so late decisions reduce matchmaking value. In addition, the framework evaluates the efficiency of finding and comparing suppliers, not the quality of production. Factory audits, sample testing, and contract performance assessment remain separate activities that an expo does not replace.
Reference document: buyers who want to review the organizer's scope and event format before shortlisting can access the expo brochure here.
Есть вопросы или нужны дополнительные детали?
Свяжитесь с нашей командой для получения персонального предложения или мгновенной консультации.
Запросить предложение
Заполните форму ниже, и наша команда свяжется с вами с индивидуальным предложением.
Прямой чат WhatsApp
Предпочитаете общаться в реальном времени? Напишите нам в WhatsApp для мгновенной помощи и быстрых ответов.
- Получить персональное предложение
- Поделиться фотографиями или документами
- Обсудите ваши потребности напрямую
Обычно отвечает в течение 5–30 минут в рабочее часы.