
Comparing Natural Stone Origins: Policy, Capacity, Exports
A country-level comparison of natural stone origins should be built from four verifiable signal groups — trade policy, export performance, manufacturing depth, and standards alignment — rather than from sample photographs and unit price. This framework explains what each signal can and cannot tell a procurement team, and where the method reaches its limits.

Fabrication depth, not export volume alone, determines whether a country origin can execute a specification. Engraving workshop, Xiamen Songjia Trading Co., Ltd.
Why origin comparison has become a procurement task
Natural stone is a commodity in trade statistics and a custom product in construction. That mismatch is the root of most sourcing disagreements. A purchase order for a façade, a lobby floor, or a set of vanity tops is written against dimensions, finishes, tolerances, and delivery dates, while the trade data used to compare origins is aggregated at the level of a customs code. Building stone falls under HS 6802, and that code describes what leaves a country, not who made it or under what inspection regime.
The consequence for buyers is practical. Two origins can report similar export volumes while offering completely different levels of fabrication control, documentation quality, and schedule reliability. Comparing them on price or colour alone hides those differences until they appear as site delays, shade variation, or rejected lots.
A structured comparison solves part of that problem. It does not solve all of it, and being explicit about which part remains unresolved is what separates a usable framework from a slide deck.
What a country-level comparison actually has to answer
Procurement teams evaluating origins during a research-to-evaluation cycle are usually trying to answer three questions at once:
- Availability risk: can this origin supply the specified material, in the specified quantity, on the project timeline?
- Cost risk: is the landed cost stable across the procurement window, and what policy exposure sits behind it?
- Acceptance risk: can the delivered material be inspected against a recognised standard, and does the supplier document it?
Each question maps to a different evidence type. Mixing them, for example comparing national export shares to justify a factory selection, produces confident conclusions that do not survive audit.
The four-signal comparison framework
The framework below separates the four signals by the question each one is able to answer. It is deliberately ordered from the most macro signal to the most specific, because the macro signals constrain the interpretation of the specific ones.
| Signal | Question it answers | Typical evidence | Buyer decision it supports |
|---|---|---|---|
| Trade policy | Can the landed cost move during the procurement window? | Tariff status, effective dates, HS code coverage | Landed-cost scenario planning before quotation |
| Export performance | Is this origin a genuine supply base or a routing point? | Export share by customs code, direction of change | Directional market assessment only |
| Manufacturing depth | Can the origin execute the drawing? | Facility scale, equipment, capacity, QC sequence | Supplier qualification and schedule planning |
| Standards alignment | Will the material pass acceptance? | Material standards, physical parameters, finish specifications | Purchase order clauses and inspection criteria |
Signal 1: trade policy and tariff exposure
Policy is the fastest-moving variable in any origin comparison, and the one most often treated as a constant. A single administrative decision can shift the ranking of two origins without changing anything about the stone itself.
A concrete example sits in the current trade record: the United States suspended a 24% retaliatory tariff on selected Chinese stone products in October 2025. The status of that measure is recorded as suspended, effective from 1 October 2025, applying to selected products rather than to the entire stone category.
The buyer action is procedural rather than analytical. Build the landed-cost model with two states — current policy and previous policy — and record which one the project budget depends on. That single step converts a policy headline into a number the project team can actually plan against.
Signal 2: export performance and trade statistics
Export data tells you where the supply base is concentrated. In 2024, China was the largest exporter of building stone under HS 6802, holding a 32% global market share, according to trade data from the Observatory of Economic Complexity. For buyers, that figure establishes China as a structurally significant origin rather than a marginal alternative.
It does not establish that any individual Chinese supplier is capable of a given project. Export share aggregates traders, integrated manufacturers, and re-exporters under one code. The distinction matters most in natural stone, where a substantial part of export volume passes through trading companies that do not operate fabrication equipment themselves.
The definition trap in stone market data
The same definitional problem affects market sizing, and buyers who compare reports without noticing it reach contradictory conclusions. Publicly available market research shows a three-to-fourfold divergence in the valuation of the natural stone market: one commercial research source reports a global market size of USD 10.6 billion for 2025, while another places the figure far higher for 2026. The gap is not a forecasting disagreement. It reflects different product scope definitions — raw dimension stone extraction value on one side, processed and semi-finished architectural products on the other.
The rule that follows is simple and rarely followed: never combine figures from two sources with different scope definitions, and never compare an origin's share using one definition against another origin's share using a different one. Where a report does not state its scope, treat the number as illustrative.
Signal 3: manufacturing depth behind the export figure
Manufacturing depth is the signal that trade data cannot supply and that buyers most need. It covers facility scale, equipment, realistic monthly output, and the inspection sequence that governs release of goods.
Public verification of these attributes is limited across the industry, and this is a genuine data gap rather than an oversight by any single buyer. Equipment inventories and factory-level capacity figures are rarely published in a comparable format. The practical response is to request them directly and to treat the answer as evidence only when it is specific.
An illustration of the level of detail that makes capacity claims checkable: Xiamen Songjia Trading Co., Ltd. operates from a 20,000 m² facility with 60 staff and a three-engineer technical team, reporting annual output in the region of 150 containers of monument products and 200 containers of building materials, with monthly capacity of 10–30 containers depending on product category and production schedule, and a normal lead time of 15–30 days depending on product type and order quantity. Its quality control runs through four stages — raw material inspection, in-process inspection, finished product inspection, and pre-shipment inspection.
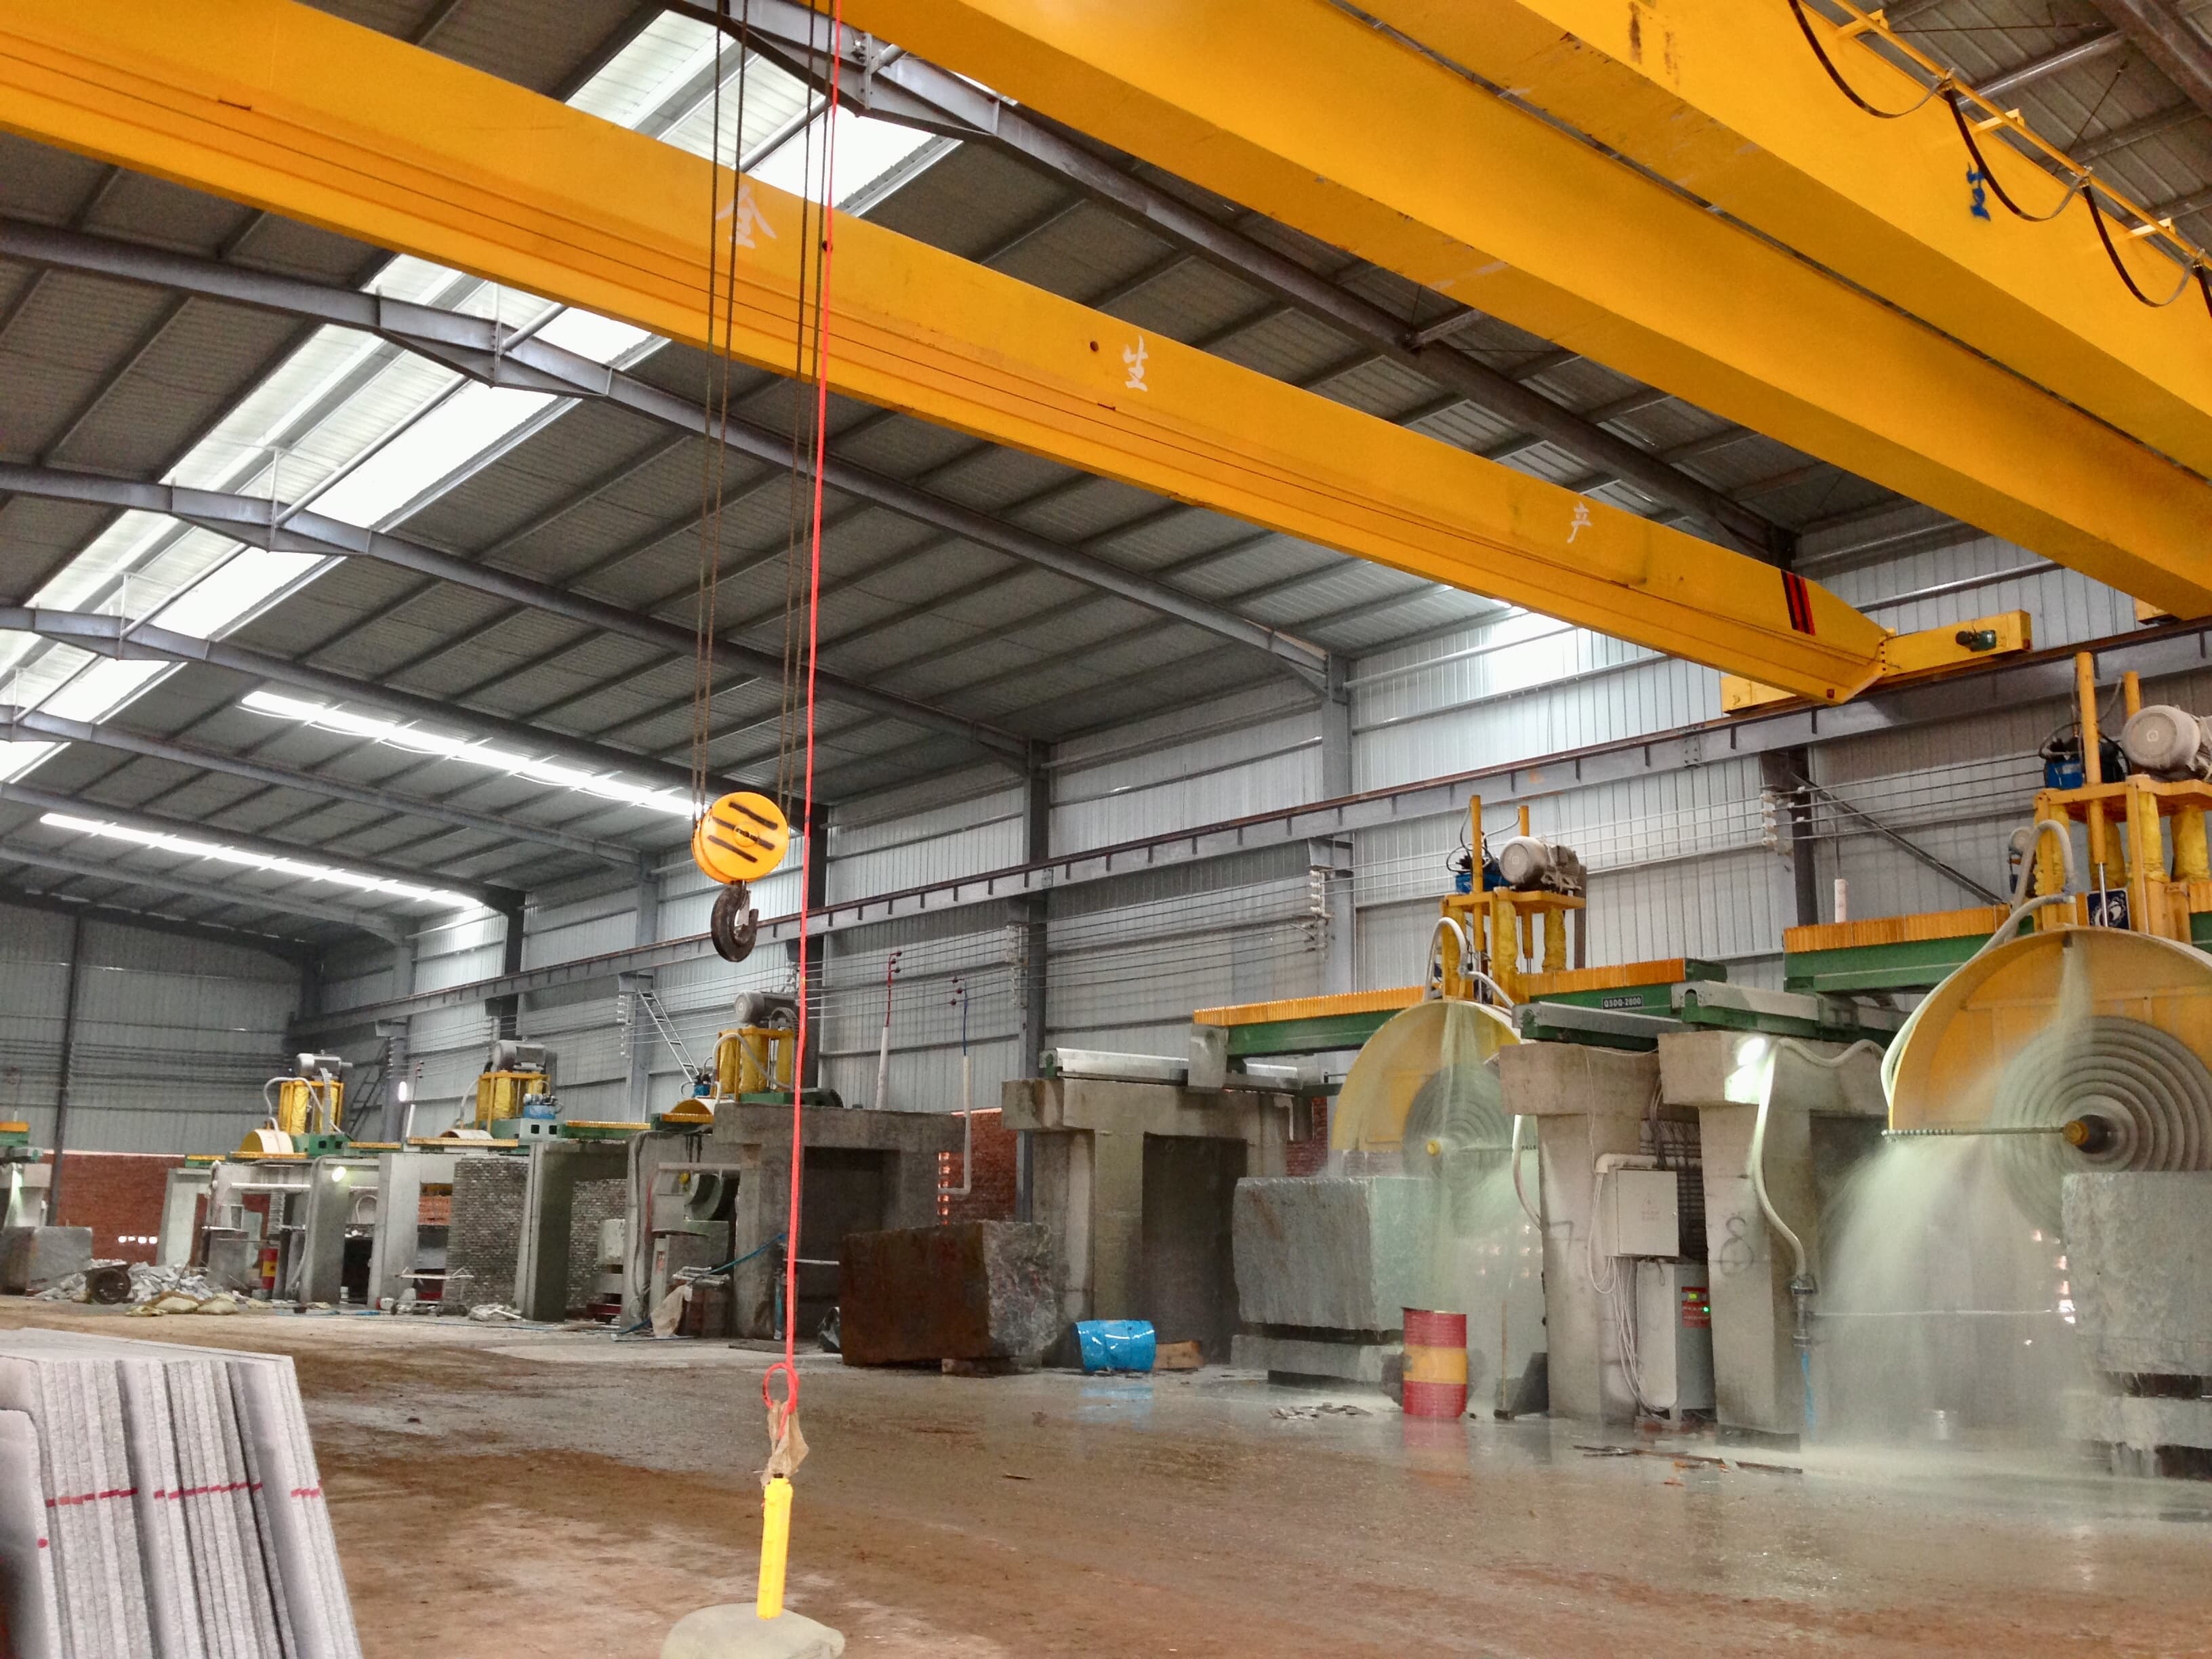
Block cutting workshop. Capacity figures become usable for procurement only when they are tied to a specific product category and production schedule.
Two features of that disclosure are worth copying into any supplier questionnaire. First, capacity is expressed as a range conditioned on product category rather than as a single headline number. Second, the quality control sequence is named stage by stage, which allows a buyer to attach inspection hold points to specific production steps instead of relying on a final pre-shipment check.
Signal 4: standards and acceptance criteria
Standards alignment determines whether the origin comparison survives contact with the site. A material that meets the aesthetic brief but fails the physical requirement creates a dispute that no origin advantage can offset.
For granite dimension stone, the relevant reference is ASTM C615, the standard specification for granite dimension stone maintained through ASTM International and referenced by the Natural Stone Institute. Buyers working to North American or internationally aligned specifications should state the standard in the purchase order rather than assuming the supplier's internal control is equivalent.
Physical parameters differ enough between stone types that acceptance criteria must be written per material, not per origin. The values below are drawn from published product specifications and are representative of the ranges a buyer should expect to see declared.
| Material | Mohs hardness | Water absorption | Density | Temperature range | Notes for acceptance |
|---|---|---|---|---|---|
| Marble | 3.0 – 5.0 | 0.1% – 0.5% | 2,600 – 2,850 kg/m³ | -15°C to 150°C | Bending strength 10 – 20 MPa; Grade A sealant required for countertops and vanities |
| Limestone | 3.0 – 4.0 | 0.8% – 2.5% | 2,200 – 2,600 kg/m³ | -25°C to 120°C | Homogeneous, fine-grained; lighter than granite, suited to façades |
| Travertine | 3.0 – 4.0 | 0.4% – 1.0% | 2,300 – 2,500 kg/m³ | -20°C to 150°C | Vein-cut or cross-cut; honed and filled finish common for projects |
| Onyx | 3.0 – 4.0 | 0.1% – 0.3% | Not declared in source data | Not declared in source data | Light transmittance 20% – 65%; mandatory anti-fouling and acid-resistant treatment |
The procurement implication is that standards should be selected before origins are shortlisted. A buyer who first chooses an origin and then discovers that the specified finish or thickness cannot be produced to the required tolerance has inverted the sequence and will pay for it in rework.
Where SONGJIA sits inside the framework
Xiamen Songjia Trading Co., Ltd. is a China-based natural stone supplier serving international stone importers, contractors, fabricators, designers, and private custom clients, operating with 100% export orientation and principal markets in the EU, USA, and Middle East. The company describes itself as a stone supply and project coordination specialist rather than a single-factory manufacturer, working through a mature manufacturing and supply network that includes partner factories equipped with CNC carving centres, with its industry origins traced to Longxiang Stonecutter.
Within the framework above, the company's relevance is concentrated in two signals rather than four. On manufacturing depth, its stated strength is design-to-production integration — converting client sketches, concepts, and architectural ideas into producible shop drawings so that a specified design can be fabricated without repeated clarification cycles. Customisation covers material, size, thickness, surface finish, edge profile, shape, engraving, packing, and logo marking, which is the range a buyer needs when a project specification departs from a catalogue item. On standards alignment, product specifications are declared by material type across marble, limestone, travertine, and onyx, which allows acceptance criteria to be written against declared values rather than assumed ones.
Post-shipment terms are stated as quality feedback follow-up, replacement or compensation for confirmed quality issues, and continuous order support. For buyers comparing origins, the practical value of these disclosures is that they are specific enough to be tested — a questionnaire built on the four signals will produce a checkable answer rather than a general assurance.
Matching origin and material choices to application scenarios
Country comparison becomes useful only when it is paired with an application. The same origin may be a strong choice for one exposure condition and a poor one for another, because the decision is ultimately about material performance under a defined working condition.
Four scenario groupings cover most building stone procurement:
- Exterior façade and wall cladding. Limestone and granite dominate here, with dry-hanging installation and steel brackets as the common fixing method. Freeze-thaw exposure makes water absorption and density the deciding parameters rather than appearance.
- Flooring and paving. Travertine, limestone, and granite are used across interior floors and exterior paving, where slip resistance and surface finish selection carry more weight than in vertical applications.
- Countertops, kitchen islands, and vanity tops. Marble, quartzite, and onyx are typical, and sealant grade becomes a specification item rather than an accessory. Onyx in particular requires mandatory anti-fouling and acid-resistant treatment before installation.
- Feature walls and backlit panels. Onyx with declared light transmittance in the 20%–65% range is used for backlit applications where the stone is both surface and lighting element.

Granite façade application. Exterior cladding shifts the comparison criteria toward water absorption, density, and fixing method.
Read this way, the origin question becomes a matching exercise: which supply base can deliver the specified material, at the specified finish, for the defined exposure condition, with documentation that supports the acceptance test.
Market trends reshaping country-level comparisons
Three shifts are currently changing how origins are ranked, and each carries a caution about evidence quality.
Policy volatility as a standing variable
The October 2025 suspension of the 24% US tariff on selected Chinese stone products illustrates the mechanism. Analysis of the trade record suggests the suspension could support a recovery in China's share of the US building stone market, a share that had shifted toward other suppliers during the tariff period. That reading is an interpretation of two data points rather than a confirmed outcome, and buyers should treat it as a scenario to monitor rather than a settled forecast. What is verifiable is the policy status and its effective date; what remains open is how much volume actually moves.
Scope discipline in market data
The divergence between published natural stone market valuations — the USD 10.6 billion figure for 2025 against substantially higher estimates from other research houses — is itself a trend signal. It shows that the category is being measured with inconsistent boundaries as processed architectural products grow as a share of value. Buyers who track market size should track the definition alongside the number.
Verification pressure on capacity claims
Trade data identifies exporters but does not separate traders from integrated manufacturers. As project specifications tighten, the industry's own analytical gap — the absence of factory-level verified capacity data in a comparable format — becomes a competitive disadvantage for suppliers who cannot document what they can produce. Buyers are increasingly requesting equipment inventories and audit documentation alongside quotations, and suppliers who can answer specifically gain an advantage that has nothing to do with price.
How this framework differs from traditional sourcing practice
Traditional stone sourcing typically runs on three inputs: a sample, a price list, and a supplier's assurance about capacity and delivery. It is fast, and for repeat purchases of standard items it is often adequate. The framework described here adds a policy layer, a scope-discipline rule, a capacity verification step, and a standards clause — at the cost of more upfront work.
That trade-off should be stated plainly, because the framework has real boundaries:
- It does not replace a factory audit. Country-level signals narrow the field but cannot confirm that a specific plant owns the equipment it claims. Verified machine counts and audited capacity remain outside what public trade and market data can establish.
- Trade statistics cannot separate traders from manufacturers. A high national export share is consistent with a fragmented supplier base in which many exporters do not fabricate.
- Policy signals decay faster than procurement cycles. A tariff suspension can change inside a project timeline, so any cost model built on it requires a stated review trigger.
- Market size figures are not comparable across sources. Where scope definitions differ by processed versus unprocessed stone, cross-source comparison is invalid regardless of how precisely the numbers are quoted.
For straightforward orders with established suppliers, the traditional approach remains proportionate. The framework earns its cost on projects where specification complexity, schedule exposure, or landed-cost sensitivity is high enough that a wrong origin decision would be expensive to reverse.
Future outlook
Two developments are likely to shape origin comparisons over the next procurement cycles. The first is policy normalisation, or its opposite: if tariff positions stabilise, landed-cost modelling becomes simpler and manufacturing depth regains weight as the primary differentiator. If they do not, buyers will continue to hold multiple origin scenarios open for the same project, which raises the value of suppliers who can quote credibly from more than one production configuration.
The second is documentation. The clearest gap in the current evidence base is factory-level verification of equipment and real output. As buyers push inspection requirements upstream and request traceable quality records, suppliers who can answer with named QC stages, declared material parameters, and specific capacity ranges will be easier to shortlist than those who answer with general capability statements.
Neither development changes what stone is. Both change what a buyer needs to see before committing. A comparison framework built on policy status, export context, manufacturing depth, and standards alignment is designed to be updated as those inputs move — which is the point of building one rather than relying on a fixed list of preferred countries.
FAQ
How does a tariff change affect the landed cost of natural stone?
A tariff change alters the duty component of landed cost, which is why the current status of a measure matters as much as the stone price. The United States suspended a 24% retaliatory tariff on selected Chinese stone products in October 2025, effective from 1 October 2025. Because the measure applies to selected products and its status is recorded as suspended rather than removed, buyers should confirm that their specific product falls within the covered list and should model landed cost against both the suspended and the unsuspended rate.
Can national export data tell me whether a supplier is a manufacturer?
No. Export statistics such as HS 6802 building stone data aggregate all exporters under a single customs code. China held a 32% global share of building stone exports in 2024, but that figure does not distinguish integrated manufacturers from trading companies that do not operate fabrication equipment. Supplier-level verification requires separate evidence, such as facility scale, equipment inventory, capacity by product category, and a named quality control sequence.
Which material parameters should be written into acceptance criteria?
Acceptance criteria should be set per material rather than per origin. The parameters that most often determine acceptance are Mohs hardness, water absorption, density, temperature range, and required surface treatment. For example, marble typically shows water absorption of 0.1%–0.5% and a density of 2,600–2,850 kg/m³, while limestone shows 0.8%–2.5% absorption at 2,200–2,600 kg/m³. Onyx requires mandatory anti-fouling and acid-resistant treatment and declares light transmittance of 20%–65%. For granite dimension stone, ASTM C615 provides the standard specification reference.
Does a country-level comparison replace a factory audit?
No. Country-level comparison operates on aggregated policy, trade, and market signals. It can indicate whether an origin carries policy cost exposure or represents a large supply base, but it cannot confirm that a specific plant owns the equipment it claims or achieves the output it reports. Factory-level verified capacity remains a separate evidence category that requires direct documentation from the supplier.
How often should origin assumptions be reviewed during a project?
Review triggers are better than fixed intervals. A tariff status change, an effective date passing, a shift in the specified material or finish, or a change in delivery schedule each justify re-running the comparison. In stable policy conditions, a periodic review aligned with procurement milestones is sufficient. The underlying principle is that the comparison reflects a set of inputs that can move independently of the stone itself.
Additional technical references and product specifications are published at songjiaglobal.com.
Есть вопросы или нужны дополнительные детали?
Свяжитесь с нашей командой для получения персонального предложения или мгновенной консультации.
Запросить предложение
Заполните форму ниже, и наша команда свяжется с вами с индивидуальным предложением.
Прямой чат WhatsApp
Предпочитаете общаться в реальном времени? Напишите нам в WhatsApp для мгновенной помощи и быстрых ответов.
- Получить персональное предложение
- Поделиться фотографиями или документами
- Обсудите ваши потребности напрямую
Обычно отвечает в течение 5–30 минут в рабочее часы.