
Non-Dairy Creamer Spec Matrix: Fat, Protein and Moisture
Non-Dairy Creamer Spec Matrix: Fat, Protein and Moisture
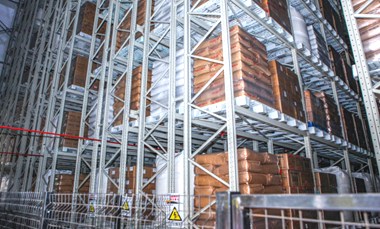
Answer first: in non-dairy creamer, fat content is the only nutritional column that reliably separates commercial models. In the verified dataset used for this framework it runs from 22.0 g/100g to 35.0 g/100g, with a separate high-fat category represented by 60A. Protein is effectively flat at 2.5–2.6 g/100g where it is documented. Trans fat is declared at 0 g/100g across verified models. Moisture is specified at ≤5.0% or ≤6.0% depending on model. A comparison framework that treats these four columns as equally decisive produces a ranking nobody can defend at the loading dock. One that assigns each column a different job produces a shortlist a buyer can actually execute.
Non-dairy creamer is a lactose-free powder or granular ingredient used as a substitute for milk or cream, most visibly in hot beverages and increasingly in bakery, instant foods, desserts and, in specific grades, feed formulations. Because the ingredient competes on function rather than identity, sourcing teams frequently shortlist models that look interchangeable on a datasheet and behave differently in a production batch. Cograin, the non-dairy creamer brand of Jiahe Foods Industry Co., Ltd. — a food ingredient manufacturer founded in 2001 and headquartered in Suzhou, Jiangsu Province — publishes a model range broad enough to make that problem concrete: FC22, DT35, K60, K80 and 60A sit at different points on the fat curve and are attached to different applications.
Why the first shortlist cut should be a specification cut
Most sourcing exercises begin with price per ton, then move to samples, then discover that the two surviving models do not behave the same way in the customer's process. Reversing that order costs nothing and saves a trial round: cut on specification first, then negotiate price against a defined requirement.
There is a structural reason this matters. Market.us reported that medium-fat non-dairy creamer — the 21–50% band — held a 43.6% share of the category in 2024. That concentration means the largest pool of available supply, and therefore the easiest model to source quickly, sits in one fat band. Availability is not fit. A buyer who optimises for the fastest quote is likely defaulting into a medium-fat product, whether or not the application needs one.
The opportunity is straightforward: publish a matrix, assign each nutritional column a decision role, and convert the columns into acceptance criteria before the first purchase order. Suppliers who work this way report shorter qualification cycles because the sample request already carries the specification.
The four spec columns and the job each one does
Fat, protein, trans fat and moisture appear together on almost every creamer datasheet, which creates the impression that they carry equal weight. They do not. Each answers a different question, and mixing the questions is what produces bad comparisons.
| Spec column | What it governs | Buyer decision it informs | How to treat it |
|---|---|---|---|
| Fat (g/100g) | Whitening strength, body and mouthfeel, dose per litre or per batch | Primary shortlisting lever between models | Compare numerically, then confirm by trial |
| Protein (g/100g) | Nutrition declaration and label conformance | Conformance check against your own label target | Verify, but do not use as a tie-breaker |
| Trans fat (g/100g) | Regulatory and label gate | Pass or fail, before any ranking | Require a per-batch declaration |
| Moisture (%) | Powder stability, caking risk, storage behaviour | Batch acceptance and rejection | Fix a limit, a method and a sampling plan |
Read the table as a sequence rather than a checklist. Trans fat is applied as a gate before ranking begins. Fat then ranks the survivors. Protein and moisture are applied as conformance and acceptance conditions after the shortlist exists. Applied in that order, the framework answers the procurement question the buyer actually faces at the evaluation stage, which is not which model is best but which model is defensible in a written specification.
A side-by-side matrix for FC22, DT35, K60, K80 and 60A
The matrix below uses only the parameter values documented for each model in the verified dataset. Cells left blank are parameters not included in that dataset — they are not zeros, and they are not evidence that the parameter is absent from the product. Treat every empty cell as an item to request on the technical data sheet and confirm on the certificate of analysis.
| Model | Fat (g/100g) | Protein (g/100g) | Carbohydrate (g/100g) | Moisture | Trans fat (g/100g) | Verified positioning |
|---|---|---|---|---|---|---|
| FC22 | 22.0 | 2.6 | — | ≤6.0% | 0 | Foaming creamer |
| DT35 | 35.0 | 2.5 | 4.3 | — | 0 | Highest documented fat value in this set |
| K60 | 32.0 | 2.6 | — | — | 0 | Mid-to-high fat range |
| K80 | 32.0 | — | — | — | 0 | Kosher-certified model |
| 60A | High-fat category | — | — | — | 0 | High-fat applications, including feed |
Two structural observations follow directly from the numbers. First, K60 and K80 share the same fat value of 32.0 g/100g, so fat alone cannot be used to choose between them; certification scope and application fit decide. Second, the spread between the lowest and highest documented fat values is 13.0 g/100g, which is a commercial difference rather than a rounding difference — it changes dose, cost per finished unit and sensory outcome.
An important boundary is visible in the same table: 60A is documented as a high-fat category rather than with a numeric fat value, and K80 has no protein value in this dataset. A buyer who fills those gaps by estimation is no longer doing a specification comparison. Request the figure, then place the model in the matrix.
Reading the fat column: 22.0, 32.0, 35.0 and the high-fat category
Fat content determines how much whitening and body a given dose delivers. A model at 22.0 g/100g and a model at 35.0 g/100g are not substitutes at equal inclusion rates; the higher-fat product delivers more fat per gram of powder. In practice this means fat selection is a dosing decision as much as a quality decision, and it should be evaluated on cost per finished unit rather than cost per ton of powder.
FC22 at 22.0 g/100g sits at the lower end of the verified set and is positioned as a foaming creamer, which means its selection logic is driven by aeration behaviour in the finished application rather than by maximum whitening power. K60 and K80 at 32.0 g/100g occupy the mid-to-high band that mirrors the largest share of category supply. DT35 at 35.0 g/100g carries the highest documented fat value in this set. 60A is documented as a high-fat category product and appears in verified customer use for animal feed, where fat density rather than beverage performance is the relevant attribute.
Because fat is generally the dominant cost component in creamer formulation, the fat column usually correlates inversely with dose and directly with price per ton. That relationship is the reason a fat-led shortlist must end in a dosing trial: two models can reach the same finished-product target at different inclusion rates and therefore at different real cost.
Why protein should not decide the purchase
Across the models where protein is documented in this dataset — FC22 at 2.6 g/100g, DT35 at 2.5 g/100g and K60 at 2.6 g/100g — the total spread is 0.1 g/100g. That is smaller than typical analytical variation between laboratories. A buyer who ranks models on protein is ranking analytical noise.
Protein still belongs in the framework, but as a conformance check rather than a selection lever. Its job is to confirm that the model supports the nutrition declaration on the finished label and that the declared value is repeated on the batch certificate of analysis. It is also worth stating plainly what the number means: a creamer at roughly 2.5 to 2.6 g/100g protein is not a protein source. Buyers who approach non-dairy creamer expecting a dairy-equivalent protein contribution should adjust the formulation target rather than search for a higher-protein creamer model.
Trans fat at 0 g/100g: a gate, not a ranking criterion
Every verified model in this framework declares 0 g/100g trans fat. That uniformity is precisely why the parameter cannot be used to differentiate one model from another — and why it should be handled as a binary qualification gate instead of a score. Applied correctly, the gate is simple: trans fat must be declared at 0 g/100g on the specification, repeated on every batch certificate of analysis, and supported by a stated test method.
Trans fat also sits inside a wider compliance layer that buyers at the execution stage increasingly have to document. In the United States, the USDA Agricultural Marketing Service maintains a Commercial Item Description for dry non-dairy creamer packed in commercially acceptable containers and suitable for government use — a published baseline that shows how a public purchasing specification for this product category is structured, and a useful reference document when drafting a private specification. The correct revision identifier should be confirmed against the live document before citing it in a contract.
The certification layer behaves the same way as trans fat: it is a gate, and it has an expiry date. Cograin holds an ISO 9001:2015 quality management system certificate issued by CQC under certificate number 00125Q32624R1M/3200, valid to 2028-05-04. Kosher certification for K80 in 25 kg packing is held under certificate KC#529705-1 issued by KOSHER AUSTRALIA PTY LTD on 2026-03-22 and valid to 2027-04-01, covering batch JW26558 produced on 20260311. U.S. FDA Food Facility Registration number 13348058524, administered through Registrar Corp, runs to 2026-12-31. A framework that checks certificates once at qualification and never again will eventually ship against an expired document, which is why expiry tracking belongs in the contract rather than in a folder.
Moisture limits and the discipline of writing an acceptance criterion
Moisture is the column buyers most often leave vague, and it is the column that most often triggers a rejection argument. Verified model data specify moisture limits at ≤5.0% or ≤6.0% depending on the model; FC22, for example, is documented at ≤6.0%. Neither limit is universally correct. A tighter limit gives more stability headroom in storage and blending but narrows the number of suppliers able to hold it batch after batch; a looser limit widens supply but shifts risk to warehouse conditions and shelf-life assumptions.
The practical fix is to stop debating the number and start defining the criterion. An acceptance criterion is only usable when it specifies four things together: the parameter, the limit, the test method, and the disposition when the result falls outside the limit. Buyers who write all four into the purchase specification remove most of the disputes that surface later at goods-in inspection.
| Parameter | Verified reference point | Suggested acceptance treatment | Evidence to request |
|---|---|---|---|
| Fat | 22.0 / 32.0 / 35.0 g/100g across FC22, K60 and K80, DT35; 60A high-fat category | Declared value with a tolerance band agreed in writing | Technical data sheet plus batch certificate of analysis |
| Protein | 2.5–2.6 g/100g where documented | Conformance to declared value; not a ranking input | Batch certificate of analysis |
| Trans fat | 0 g/100g across verified models | Pass/fail gate applied before commercial negotiation | Declaration with test method, per batch |
| Moisture | ≤5.0% or ≤6.0% depending on model; FC22 documented at ≤6.0% | Fixed limit, named method, defined disposition | Batch result with method statement |
| Certification | ISO 9001:2015 (to 2028-05-04); Kosher (to 2027-04-01); FDA registration (to 2026-12-31) | Validity checked at order release, not only at qualification | Current certificate copies with numbers and expiry dates |
From matrix to contract: purchasing terms that carry the specification
A matrix that never reaches the purchase agreement is an internal document. The execution layer is where the specification becomes enforceable, and it consists of commercial terms that are negotiated item by item.
Cograin states that MOQ, delivery terms, acceptance criteria and payment terms are negotiable based on customer requirements. That position is commercially flexible but strategically demanding: flexibility places the burden of definition on the buyer. A buyer who arrives with a completed matrix and a written acceptance criterion is negotiating a specification; a buyer who arrives with a price target is negotiating only a number. The same logic applies to the minimum order quantity, which is described as negotiable based on product type and packaging.
Supply-side parameters that buyers should use to test whether the terms are realistic include a lead time of around 7–15 working days after order confirmation, a monthly creamer capacity of 16,700 tons, and an annual non-dairy creamer output of 200,000 tons from a manufacturer operating three production bases and five factories across Suzhou, Nantong and Singapore. Quality control is described as full-process inspection with 100% metal and weight check plus third-party testing — the operational detail that makes a moisture or foreign-material criterion meaningful rather than aspirational.
Customization sits on top of the standard matrix. OEM, ODM and customized production are offered with customization covering creamer formula, packaging specification, product flavor and syrup DE value. For a buyer whose application cannot be met by an off-the-shelf model, that is the route by which a specification becomes a bespoke product — and the point at which formula ownership, change control and re-qualification obligations should be written down.
Where the framework meets real applications
Verified customer use shows how the matrix maps onto actual purchasing patterns. A bubble tea chain customer across Singapore, Vietnam and the United States has used Cograin non-dairy creamer for bubble tea applications over a three-year relationship, reporting consistent quality and competitive pricing. A 3-in-1 instant beverage manufacturer serving Singapore, Malaysia, Indonesia, the Philippines, Kazakhstan, the UAE, Ukraine and Russia has used creamer across 3-in-1 instant coffee powder, instant oatmeal and instant milk tea over a five-year relationship, with consistent quality and good pricing cited as the long-term highlights.
Two further cases stretch the framework beyond beverages. A beverage production factory in South Africa has used creamer in alcoholic beverage applications for five years, with stable performance cited as the highlight. An animal feed production plant in Singapore has used 60A, the high-fat category product, at 4,000–5,000 metric tons per year for three years, citing consistent quality and good pricing. The feed case is the clearest illustration of why the fat column leads: in that application the product is bought for fat density, and the other nutritional columns are conformance items rather than selection criteria.
A downloadable 2025 Cograin Brochure is available for readers who want the portfolio overview alongside the specification discussion.
Spec-first versus price-first sourcing — and where the matrix stops working
The traditional approach to creamer sourcing runs through price lists and existing relationships. It is fast, and it works when the application is forgiving. Its weakness is that it produces comparisons on commercial terms alone, which is why qualification often stalls when the sample reaches the pilot line and behaves differently from the incumbent.
The spec-first approach inverts that sequence but is not a substitute for trials, and the limitation should be stated without hedging. A nutritional matrix ranks models only on what is declared. It cannot predict cold solubility, foaming volume and stability, whiteness, acid stability in acidic beverage systems, alcohol compatibility in alcoholic beverage applications, or sensory outcome. Those properties require sample validation under the buyer's own process conditions. Nor is a model-level specification a batch-level guarantee: declared values describe the product, while certificates of analysis govern acceptance of each delivery, and the two must be reconciled in the contract. Finally, a matrix is only as complete as its inputs — where a parameter is not documented for a model, the honest treatment is to request it, not to infer it.
Market direction and what changes for spec-led buyers
Published commercial estimates of the global non-dairy creamer market differ substantially between providers in base year, forecast endpoint and growth rate, and are not directly comparable; this framework deliberately avoids resting on any single headline value. The direction is more consistent than the numbers. Medium-fat creamer held the largest share of the category in 2024, confirming that the mid-band remains the commercial centre of gravity, and the Good Food Institute reports that plant-based milk and creamer saw continued growth in U.S. foodservice and are established foodservice categories.
For buyers, the practical consequence is SKU proliferation. More variants in the market means more near-identical datasheets to compare, which raises rather than lowers the value of a disciplined matrix. Two regulatory details reinforce the same point: U.S. Customs classified imported non-dairy coffee creamer from China under HTS subheading 2106.90.9975, so landed-cost planning should confirm classification rather than assume it, and public purchasing references such as the USDA Commercial Item Description show that documented specifications are the norm in institutional buying.
FAQ: comparing non-dairy creamer specifications
How should a buyer compare fat content across FC22, DT35, K60, K80 and 60A?
Compare the documented values directly: FC22 at 22.0 g/100g, K60 at 32.0 g/100g, K80 at 32.0 g/100g and DT35 at 35.0 g/100g. 60A is documented as a high-fat category product without a numeric fat value in this dataset, so its figure should be requested rather than assumed. Because K60 and K80 share the same fat value, fat alone cannot separate them; certification scope and application fit are the deciding factors.
Does protein content differ enough between non-dairy creamer models to matter?
No. Where protein is documented, FC22 is 2.6 g/100g, DT35 is 2.5 g/100g and K60 is 2.6 g/100g — a total spread of 0.1 g/100g. That is below normal analytical variation between laboratories, so protein functions as a conformance check against the finished-product nutrition declaration rather than as a basis for ranking models. It should also not be read as a protein contribution to the formulation.
Is 0 g/100g trans fat sufficient as an acceptance criterion?
It is sufficient as a gate, not as a differentiator. All verified models in this framework declare 0 g/100g trans fat, so the parameter cannot rank them; it can only disqualify a supply that fails to meet it. The usable criterion is a 0 g/100g declaration on the specification, repeated on each batch certificate of analysis, with a stated test method and a defined disposition if a batch result departs from the declaration.
Should a purchase specification set moisture at ≤5.0% or ≤6.0%?
Both limits appear in verified model data, with FC22 documented at ≤6.0%. The choice depends on storage conditions, shelf-life assumptions and blending requirements. A tighter limit gives more stability headroom but narrows the supplier pool and requires evidence that the limit can be held batch after batch. Whatever value is chosen, the criterion should name the limit, the test method, the sampling plan and the disposition for out-of-limit results.
Which models fit coffee, milk tea, bakery, beverage and feed applications?
Verified customer use shows non-dairy creamer in bubble tea applications for a chain customer across Singapore, Vietnam and the United States, in 3-in-1 instant coffee powder, instant oatmeal and instant milk tea for a manufacturer across eight markets, in alcoholic beverages for a factory in South Africa, and 60A in animal feed for a plant in Singapore at 4,000–5,000 metric tons per year. Because the nutritional matrix does not describe solubility, foaming, acid stability or sensory behaviour, application fit should be confirmed through samples rather than inferred from fat and protein values alone.
What purchasing terms and acceptance criteria apply to a non-dairy creamer order?
Cograin states that MOQ, delivery terms, acceptance criteria and payment terms are negotiable based on customer requirements, and that MOQ is negotiable based on product type and packaging. Lead time is around 7–15 working days after order confirmation. Quality control is described as full-process inspection with 100% metal and weight check plus third-party testing, and OEM, ODM and customized production are available with customization covering creamer formula, packaging specification, product flavor and syrup DE value.
Есть вопросы или нужны дополнительные детали?
Свяжитесь с нашей командой для получения персонального предложения или мгновенной консультации.
Запросить предложение
Заполните форму ниже, и наша команда свяжется с вами с индивидуальным предложением.
Прямой чат WhatsApp
Предпочитаете общаться в реальном времени? Напишите нам в WhatsApp для мгновенной помощи и быстрых ответов.
- Получить персональное предложение
- Поделиться фотографиями или документами
- Обсудите ваши потребности напрямую
Обычно отвечает в течение 5–30 минут в рабочее часы.