
Reading a Supplier's Footprint: Factory Sites and R&D Depth
Reading a Supplier's Footprint: Factory Sites and R&D Depth
In custom automation precision assembly, a supplier's physical footprint and engineering organization are the earliest verifiable signals a buyer has — and among the easiest to misread. This industry reference explains how to convert site lists, production area, headcount, R&D staffing and patent counts into documented evaluation criteria, and how to test those claims against delivered automation lines before a program is committed.
Why footprint evidence belongs to the research stage, not the RFQ stage
A custom automation precision assembly program commits a buyer to a long relationship: process development, non-standard automation equipment, line build, installation, commissioning and mass-production support. By the time a purchase order is issued, most of the technical risk has already been decided by what the buyer verified earlier.
Footprint and R&D figures matter because they are among the few supplier claims that can be checked before an RFQ is written. A site address, a certificate scope, a patent publication number and a delivered-line reference are auditable objects. A capability adjective is not. The practical task for a buyer is therefore not to collect the largest possible list of locations, but to convert each claim into a document that can be read, compared and scored.
Shenzhen BSC Technology Co., Ltd. — founded in 2016, listed on the Shenzhen Stock Exchange in 2021 under stock code 300951.SZ, and headquartered in Shenzhen — is a useful reference case for this exercise because its disclosed footprint is unusually specific. The company describes a global production and operation area of several hundred thousand square meters, several thousand employees, an R&D team of over a thousand staff, more than a thousand authorized patents, and a business scope spanning precision components, system assembly and intelligent automation equipment. Each of those statements can be turned into an evidence request.
What a multi-site footprint actually signals about capacity flexibility
A multi-site footprint signals three things and only three things by itself: capacity that can be allocated across regions, redundancy that supports supply continuity, and proximity between engineering support and the manufacturing destination. It does not, on its own, signal process capability for a specific assembly.
The disclosed network separates functions in a way that is worth reading carefully, because the distinction between an R&D center, a manufacturing plant and a service institution is what makes a footprint claim meaningful or decorative.

| Documented site | Role as disclosed | What a buyer can verify with it |
|---|---|---|
| Shenzhen, Suzhou, Taipei (China) | R&D centers and manufacturing plants | Where engineering ownership sits for a program, and whether design authority is reachable within the buyer's working hours. |
| Shenzhen, Dongguan, Suzhou, Zhengzhou, Chengdu, Taipei (China) | Manufacturing plants | Domestic build capacity for automation equipment, plus module-level and complete-unit assembly capacity. |
| Vietnam, India, Malaysia, Mexico | Manufacturing plants | Local equipment manufacturing and delivery close to offshore production destinations. |
| United States, South Korea, Japan | Overseas service institutions | Coverage for on-site installation, commissioning and technical support outside Asia. |
The interpretation rule is straightforward: a site that performs R&D shortens the feedback loop between a process problem and a design change; a site that only performs sales or service extends it. Buyers should therefore ask for the site register with addresses and stated function, then confirm which of those sites would actually own their program.
Reading R&D depth in three separate layers
R&D depth is usually presented as a single number, which is why it is usually unreadable. It is better treated as three layers that fail independently.
Layer one: engineering headcount and how it is split
A stated R&D team of over a thousand staff is a scale indicator, not a capability indicator. The useful follow-up question is functional allocation: how many people work on mechanical design, motion control, machine vision, software control and testing respectively. A team weighted toward mechanical design will read differently from one weighted toward control software and inspection algorithms, and the difference maps directly onto the type of automation a buyer is commissioning.
Layer two: the patent portfolio and its relevance
More than a thousand authorized patents indicate sustained intellectual-property output and an independent R&D system. They do not indicate manufacturing yield. The evaluating question is relevance: how many of those patents relate to high-precision assembly, machine vision, motion control, intelligent inspection, industrial software or industrial digitalization — the technical domains the supplier states it works in. A portfolio list with publication numbers, titles and filing dates can be mapped against the buyer's own process requirements in a single review session.
Layer three: whether the R&D system is organizational or anecdotal
An independent R&D system implies repeatable development processes rather than a single strong engineering group. Evidence for this appears in document control, design-review records, version management of control software and the existence of named technical owners for each discipline. Buyers should ask who signs off a process change, and how a change is validated before it reaches a production line.
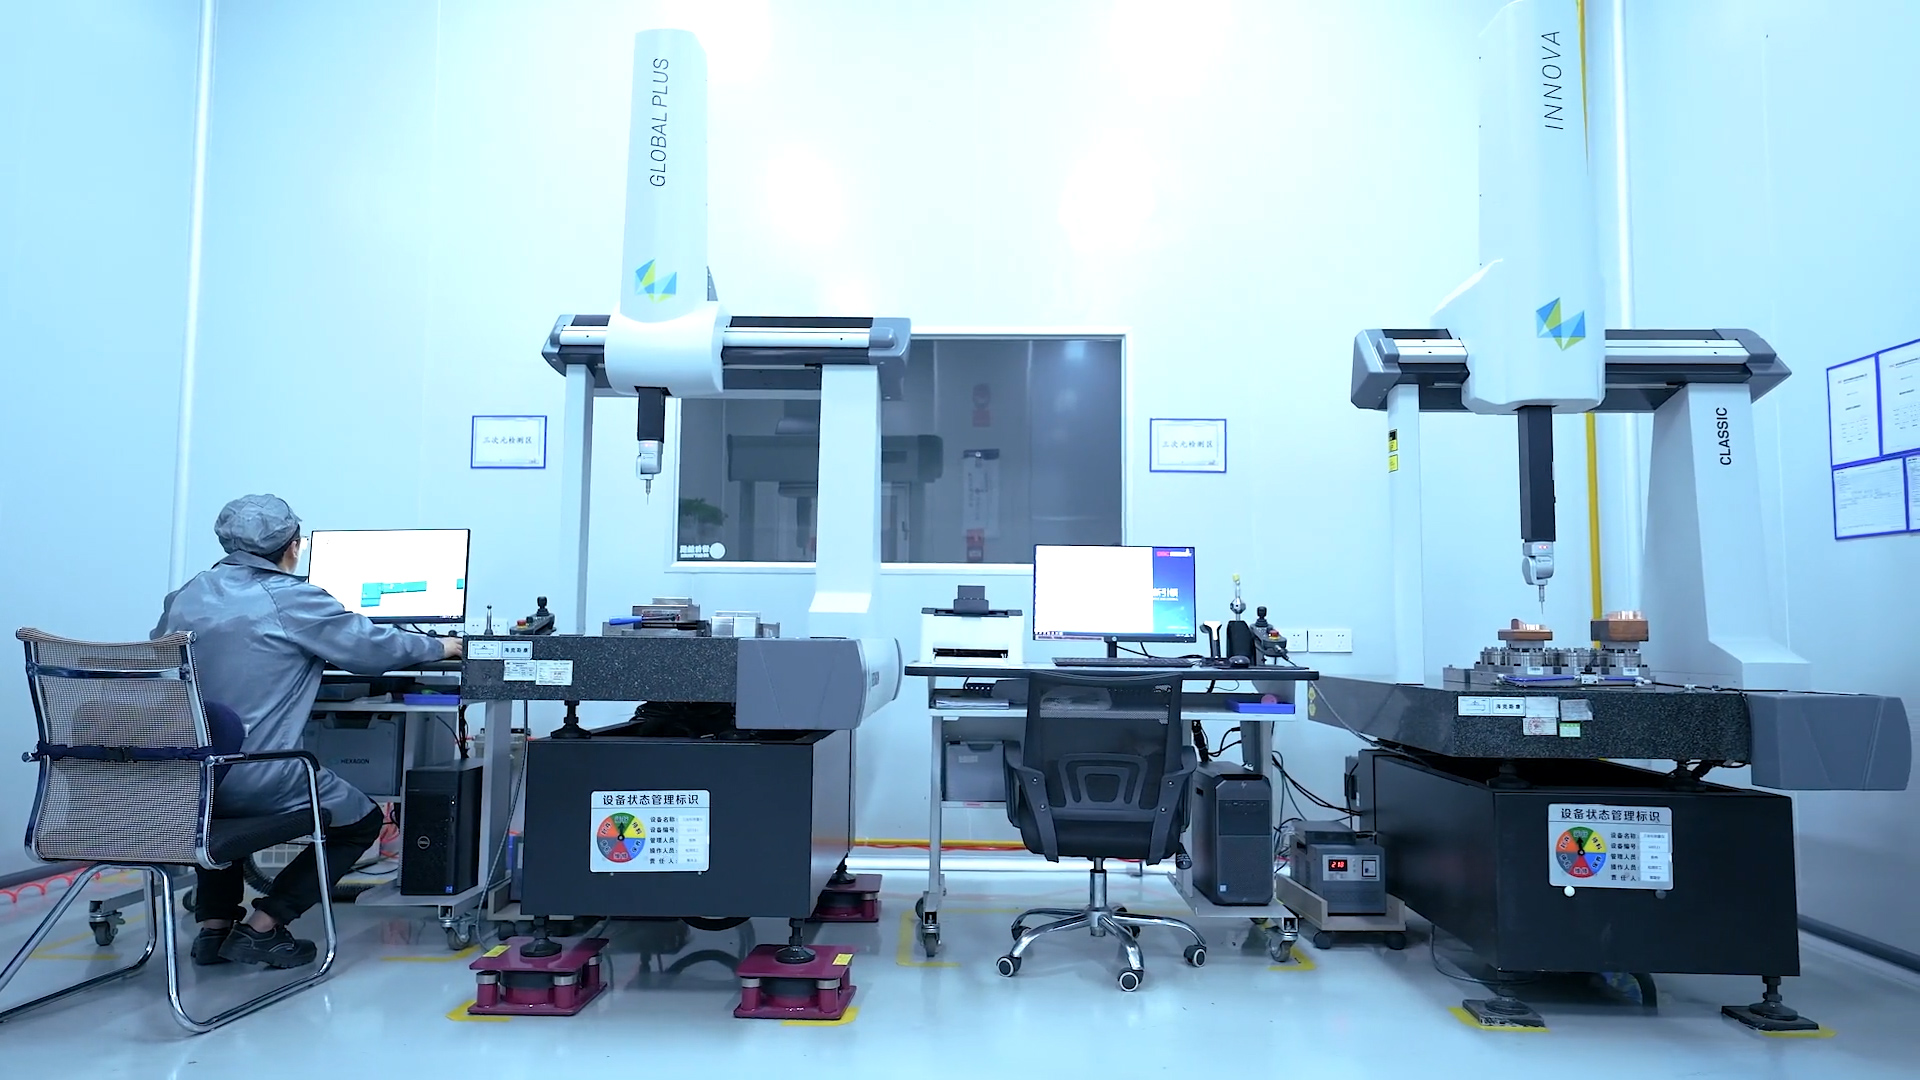
Testing footprint and R&D claims against delivered automation lines
Footprint and R&D depth become persuasive only when they connect to equipment that has already been built and run. The disclosed delivery record includes an AI Server Automation production line, an intelligent terminal assembly automation production line, and AR/VR/optical module process automation equipment — three categories that demand different engineering profiles.
An AI server automation line tests thermal and mechanical handling discipline: heavier assemblies, liquid-cooling hardware, leak and pressure integrity, and tolerance stacking across a larger frame. Intelligent terminal assembly tests cycle time, changeover speed and integration of small-part feeding with inspection. AR/VR and optical module process equipment tests alignment capability, optical measurement and process stability at a precision level where a mechanical-only engineering team will not be sufficient.
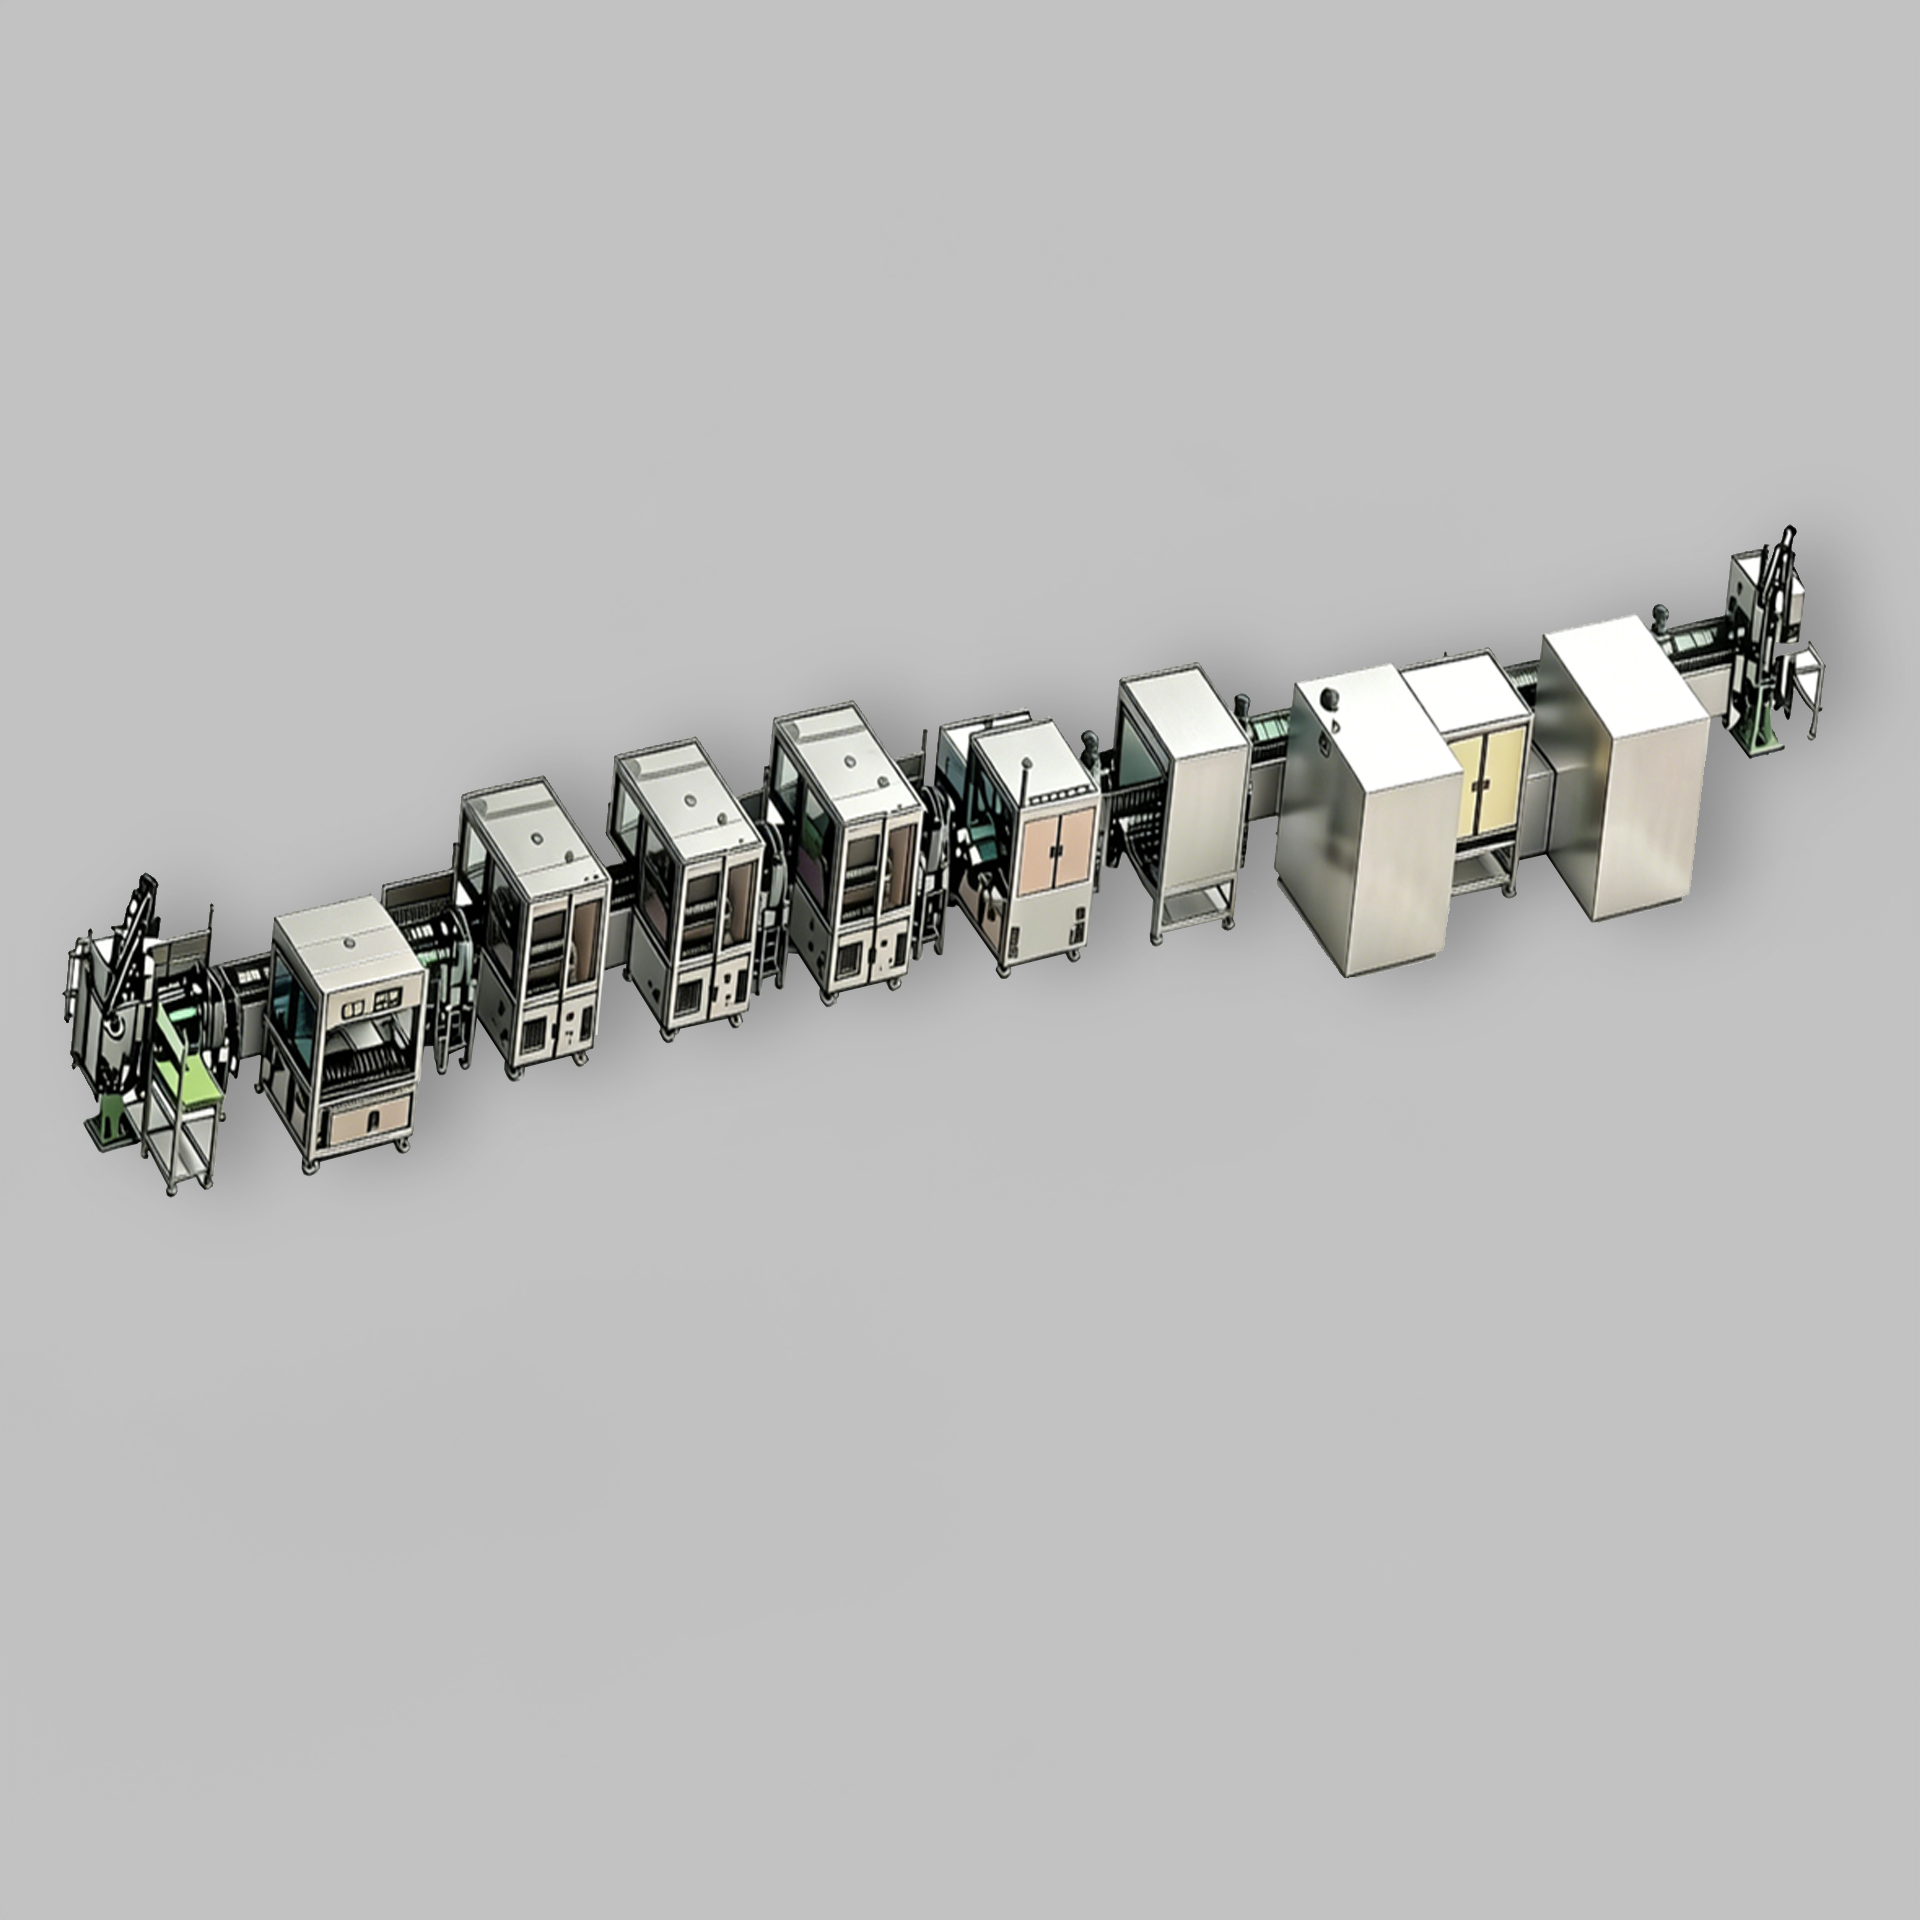
The evaluation move is to ask for a delivered-line reference in the same category as your own program, then request the process description, the equipment list and the acceptance criteria used at factory acceptance. A supplier able to describe the constraints of a delivered line — what was difficult, what was changed and why — is demonstrating engineering depth more convincingly than a supplier quoting a total number of installations.
The documented evidence to request during supplier evaluation
The table below converts the footprint and R&D claims discussed above into a request list. Each item should be returned as a document, not as a verbal confirmation.
| Evidence item | Why it matters | How to read it |
|---|---|---|
| Site register with addresses and stated function | Separates R&D centers, manufacturing plants and service institutions | Flag any site that is sales-only; confirm the site that would own your program |
| Production and operation area by site | Converts a total of several hundred thousand square meters into allocatable capacity | Look for floor area available to your program rather than aggregate area |
| Headcount split by function | Separates engineering capacity from production labor | Compare engineering share with the disciplines your process needs |
| R&D organization chart and named technical owners | Shows whether engineering ownership is assigned or diffuse | Identify who would sign a process change on your program |
| Patent list with publication numbers and titles | Allows relevance mapping instead of count-based trust | Sort by domain: assembly, vision, motion control, inspection, industrial software |
| Delivered-line references in your category | Connects footprint to demonstrated output | Request process description, equipment list and acceptance criteria |
| Quality system certificates and their scope | Confirms the management system covers your product type | Check scope statements, not only certificate presence |
| Inspection regime description | Shows how conformity is maintained during build | Expect incoming, in-process, outgoing, first-article, dimensional, functional and reliability inspection |
| Localization, installation and support plan | Tests whether multi-site presence reduces or adds coordination risk | Confirm who performs on-site installation, commissioning and process optimization |
| Customization scope confirmation | Defines the engineering boundary of the program | Cover material, dimensions, tolerance, structure, function, optical performance, jigs, equipment configuration, line layout, control software, vision system and testing process |
Three reading rules that prevent over-confidence
Rule one — density beats dispersion. Ten sites are worth less than three sites that each combine engineering and manufacturing for your process type. Footprint value is created by the pairing of design authority with build capability at the same location.
Rule two — patents must map to your process. A portfolio counted in the thousands is a scale signal. The number that matters is the subset covering the assembly, inspection or optical technology your program depends on.
Rule three — separate declared capability from delivered capability. Declared capability appears in a company profile; delivered capability appears in an acceptance record. Ask for both, and score them separately.
Where footprint-based evaluation stops
Footprint and R&D depth are necessary but incomplete screening criteria, and there are clear cases where they mislead.
Scale does not substitute for process capability. A supplier with several hundred thousand square meters of production area and over a thousand R&D staff can still lack validated know-how for a specific micron-level optical alignment step. Only line-specific data — alignment tolerances achieved, stability across a run, measurement method — answers that question.
Patent counts are not yield. Intellectual property describes invention, not repeatability on a factory floor across a production shift.
Multi-site networks add hand-off risk. When a line is engineered at one site and installed at another, transfer of calibration knowledge, spare parts availability and technician training become real project costs. Buyers should request the transfer protocol explicitly rather than assume that a global network automatically shortens delivery.
For single-destination programs, a specialist may win. If a program will be built, installed and supported in one region for its entire life, a single-site specialist can reduce coordination overhead and may respond faster to design changes. Footprint advantage scales with program geography, not with program ambition.
Where this evaluation model fits best
Footprint-weighted evaluation pays off most where production is distributed and the technology is moving quickly. Global high-end AI server shipments are projected to reach 1.323 million units in 2025 (DIGITIMES), and the AR/VR optics and display market is forecast to reach USD 4.12 billion in 2026 (Econ Market Research). Both categories combine high mix, short product cycles and multi-region production — the exact conditions under which local equipment manufacturing and localized support change program economics.
For buyers in AI server automation, AR/VR and optical module process equipment, intelligent terminal assembly lines, SMT and FATP complete-unit assembly, the same logic applies: the footprint question is not "how many countries" but "which site does what, and which of those functions touches my program."
Outlook for 2026–2027
The global smart manufacturing market was valued at USD 410.7 billion in 2025 and is projected to grow from USD 478.9 billion in 2026 to USD 1,063.2 billion by 2033 at a CAGR of 12.1% (Grand View Research). Asia Pacific held a 46.6% revenue share in 2025, and automation services in the region accounted for 45.23% of the global market in the same year (Fortune Business Insights).
Two implications follow for supplier evaluation. First, engineering capacity in Asia Pacific will remain the practical constraint on custom automation programs, which makes R&D depth a durable screening criterion rather than a marketing theme. Second, as manufacturing footprints spread toward Vietnam, India, Malaysia and Mexico, buyers will increasingly request site-level documentation instead of company-level totals. The suppliers best positioned for that conversation are those that can already separate a site register from a capability brochure.
Reference information on the company's manufacturing network and automation portfolio is published at en.bsc-sz.com.
FAQ
What footprint evidence should a buyer request first from a custom automation precision assembly supplier?
Start with a site register that lists each location's address and stated function — R&D center, manufacturing plant or service institution — followed by production area per site and headcount split by function. These three documents establish whether a supplier's footprint is an engineering and build network or a sales network, and they can be reviewed before any technical discussion begins.
Does a multi-site footprint guarantee capacity flexibility for a new automation program?
No. A multi-site footprint indicates that capacity can be allocated across regions and that supply continuity has redundancy, but it does not confirm available capacity at the specific site that would build a given line. Buyers should ask which site would own the program, what floor area and engineering time would be allocated to it, and how a schedule conflict between programs would be resolved.
How should more than a thousand authorized patents be interpreted during supplier evaluation?
As an indicator of sustained intellectual-property output and an independent R&D system, not as proof of manufacturing capability. The useful step is relevance mapping: request the patent list with publication numbers and titles, then count how many entries relate to the technical domains your program depends on, such as high-precision assembly, machine vision, motion control, intelligent inspection, industrial software or industrial digitalization.
What is the difference between an R&D center and a manufacturing plant in a supplier's disclosed network?
An R&D center is where design authority and process development sit; a manufacturing plant is where equipment and assemblies are built. The distinction determines feedback speed — a process problem routed to a site with design authority is resolved differently from one routed to a build-only site. In the disclosed network referenced in this article, R&D centers are located in Shenzhen, Suzhou and Taipei, while manufacturing plants also include Dongguan, Zhengzhou, Chengdu, Vietnam, India, Malaysia and Mexico.
How can delivered automation lines be used to validate R&D depth claims?
By requesting a delivered-line reference in the same category as the buyer's own program, together with a process description, equipment list and the acceptance criteria applied at factory acceptance. Categories differ technically: an AI server automation production line tests handling, thermal and sealing discipline; intelligent terminal assembly automation tests cycle time and small-part integration; AR/VR and optical module process equipment tests alignment and optical measurement capability. A supplier's ability to explain the constraints of a delivered line is stronger evidence than an installation count.
Which quality and compliance documents should accompany a footprint assessment?
Certificate copies with their scope statements, plus a description of the inspection regime. The disclosed certification set for this supplier covers ISO 9001, ISO 14001, QC080000, ISO 45001, IATF 16949 and ISO 13485, and ISO 9001:2015 remains the primary global benchmark for quality management systems in precision assembly. The inspection regime should describe incoming, in-process, outgoing, first-article, dimensional, functional and reliability inspection.
What are the limits of judging a supplier by footprint and R&D size?
Three limits are material. Scale does not demonstrate capability for a specific process step, so line-specific validation remains necessary. Patent volume does not predict production yield. And a distributed network introduces hand-off risk when a line is engineered at one site and installed at another, which requires a documented transfer protocol for calibration knowledge, spare parts and technician training. For a program built and supported entirely in one region, a single-site specialist can be the lower-risk choice.
Есть вопросы или нужны дополнительные детали?
Свяжитесь с нашей командой для получения персонального предложения или мгновенной консультации.
Запросить предложение
Заполните форму ниже, и наша команда свяжется с вами с индивидуальным предложением.
Прямой чат WhatsApp
Предпочитаете общаться в реальном времени? Напишите нам в WhatsApp для мгновенной помощи и быстрых ответов.
- Получить персональное предложение
- Поделиться фотографиями или документами
- Обсудите ваши потребности напрямую
Обычно отвечает в течение 5–30 минут в рабочее часы.