
Storage Battery Growth Markets: Three Signals to Watch
Storage battery demand is no longer distributed evenly across the world's markets, and that divergence has become a procurement variable rather than background noise. Global Battery Energy Storage System (BESS) market size reached approximately USD 13.2 billion in 2025 and is projected to grow to USD 99.7 billion by 2033, according to Grand View Research. The trajectory is credible; the distribution is not even. The countries that actually absorb that growth will be the ones where policy pays for storage rather than only for generation, where grid or residential deployment targets create predictable volume, and where cell, pack and system supply can be delivered on schedule.
For importers, distributors, EPC contractors and brand owners working through a decision-stage evaluation, that shifts the useful question. "Which market is largest" is far less actionable than "which market's signal set matches what I can supply, certify and service." The same 48V wall-mounted unit can be a mainstream residential product in one market and an awkward import in another, purely because of certification scope, tariff structure, or the way self-consumption is compensated.
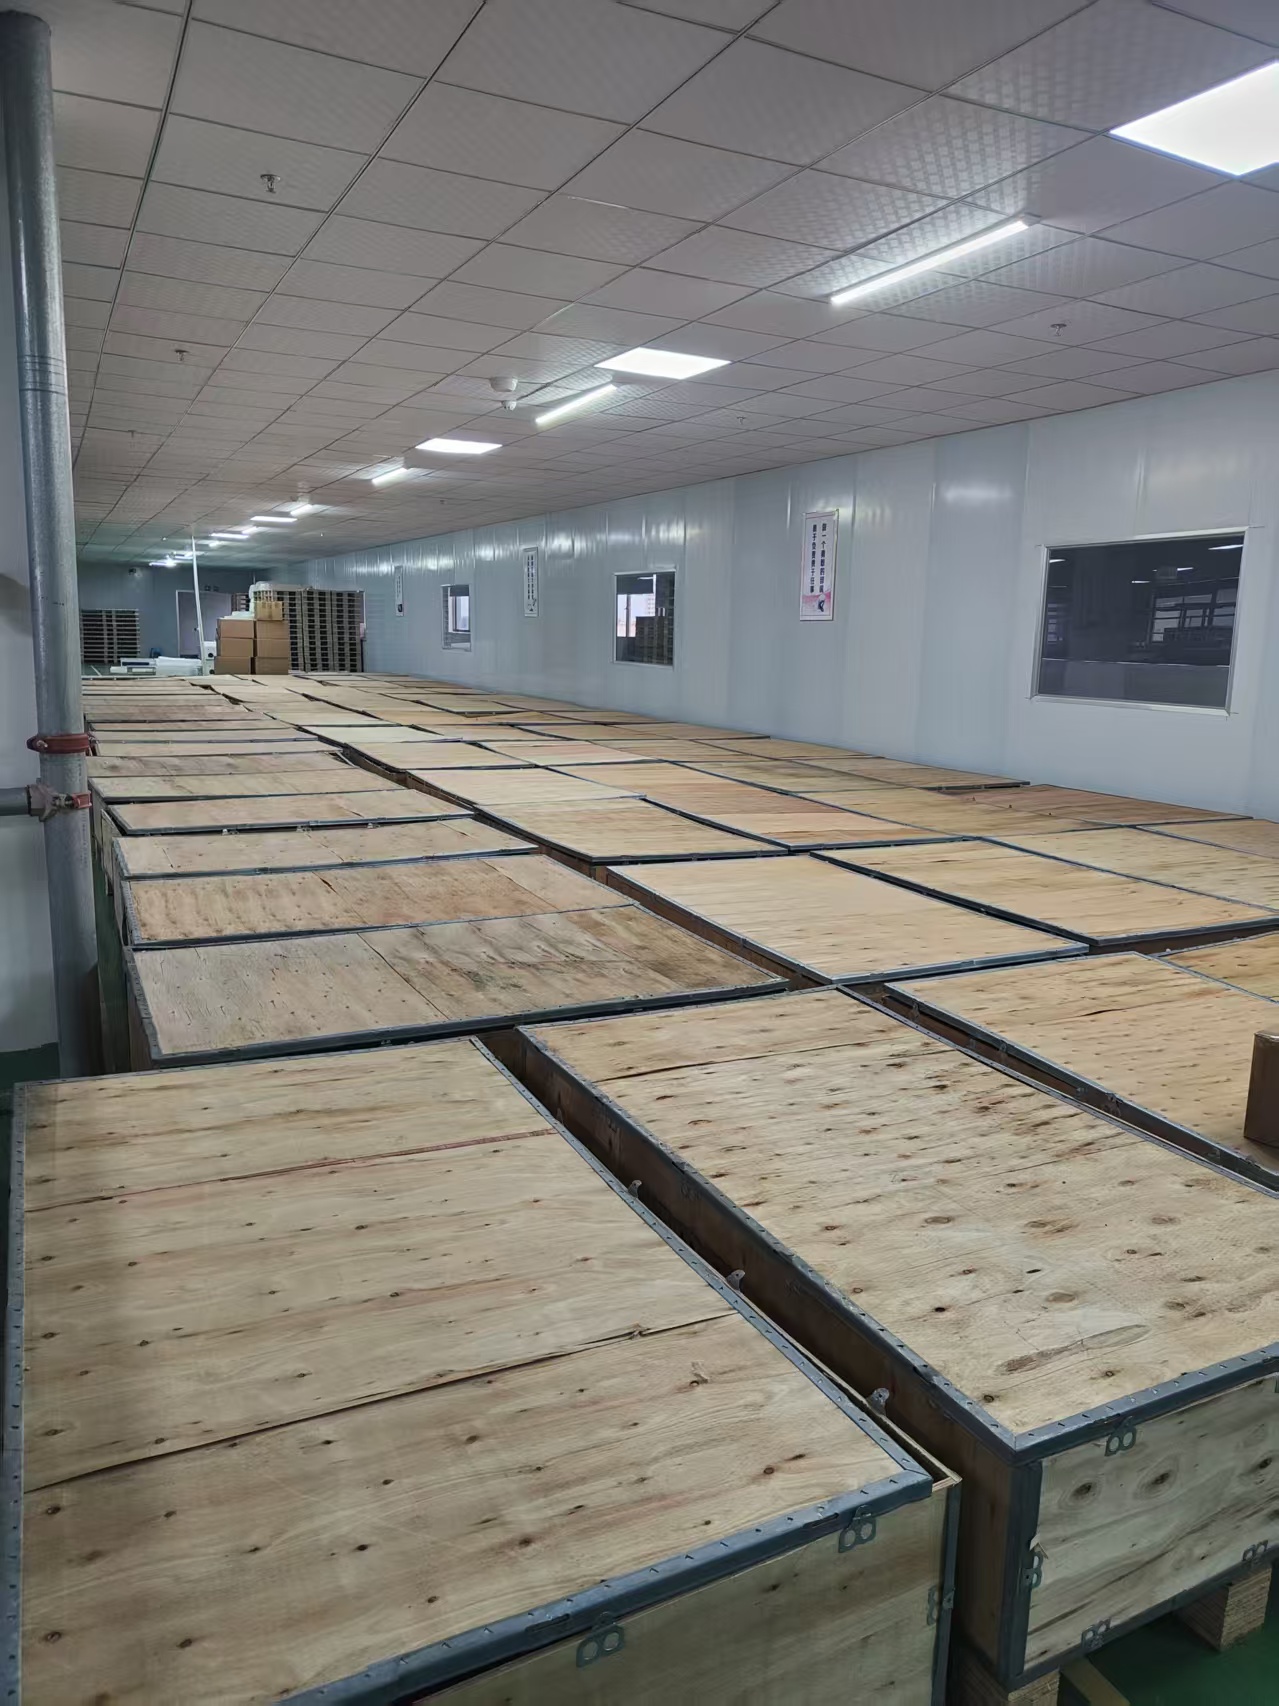
Capacity build-out, not headline demand, is what determines whether a shortlisted market can actually be served. Image: Shenzhen Topway New Energy Co., Ltd. (HCC).
Why Market-Level Signals Now Outrank Product Specs Alone
Storage battery procurement was historically organised around product questions: voltage, capacity, chemistry, cycle life. Those still matter, but they are increasingly the second filter. The first filter is jurisdictional. A lithium iron phosphate pack that clears every technical requirement in a residential retrofit programme may be commercially unworkable in a market where transport documentation, safety scope or local content expectations are structured differently.
Two structural facts make this worse for buyers who plan on product data alone. First, chemistry is not yet settled at the system level: lithium-ion batteries held the largest share in the BESS industry, accounting for 53.5% of the total in 2025 (Grand View Research), which means the remaining share is still genuinely contested by alternatives. Second, the integrator layer is already concentrated — Tesla led the global BESS integrator market with a 15% share in 2024, followed closely by Sungrow at 14% (Wood Mackenzie). Concentrated integration upstream tends to push smaller buyers downstream into differentiated formats, regions and service models, which is exactly where market selection starts to matter.
The opportunity sits in that gap. Markets with clear deployment targets and underdeveloped local pack capacity are where cross-border sourcing still adds value. Markets with mature local manufacturing and settled certification regimes are where sourcing decisions become a price and logistics exercise rather than a capability exercise.
Four Signals That Separate Real Demand From Announced Demand
A country-level storage target is a statement of intent. A country-level procurement rule is a cash flow. The distinction is the entire basis of a workable shortlist, and it can be assessed through four observable signals.
- Policy incentives that pay for storage. What matters is whether the mechanism compensates storage duration, capacity availability or self-consumption — not whether a national strategy document mentions batteries.
- Grid and residential deployment targets. Utility procurement obligations, capacity mechanisms and residential retrofit schemes convert intent into repeatable order volume. Targets without a buying entity attached rarely do.
- Manufacturing capacity build-out. Local cell, module and pack capacity shortens lead times and reduces freight exposure, but announcements should be separated from verified output.
- Export performance and trade flows. Who is a net exporter, who is a net importer, and which rules govern that flow. For cross-border buyers this signal usually determines landed cost more than any product specification does.
| Signal | What to look for | What it changes for buyers |
|---|---|---|
| Policy incentives | Whether storage duration or capacity is directly compensated | Determines whether residential or grid-scale formats dominate local demand |
| Deployment targets | Whether a named entity is obligated to procure | Converts demand forecasting from speculation into order scheduling |
| Capacity build-out | Verified output versus announced lines | Sets realistic lead times and reduces dependency on long-haul freight |
| Export and trade flow | Net export position and applicable conformity rules | Drives landed cost, documentation burden and certification scope |
The Shortlist: Five Market Archetypes Rather Than a Country League Table
Because national data is revised frequently and definitions of "storage market" vary by source, the more stable way to shortlist is by archetype. Each archetype produces a recognisable demand signature.
1. Policy-led residential retrofit markets
In a number of European markets, residential storage economics have been shaped by retail electricity pricing, self-consumption rules and retrofit support. Demand in these markets skews toward compact, wall-mounted, high-voltage or 48V formats that install quickly in existing homes and integrate with rooftop photovoltaic systems. Buyers sourcing for these markets should expect conformity documentation to be part of the purchase specification rather than an afterthought, and should expect competition from locally assembled packs.
2. Utility-scale tender markets
Markets where transmission or distribution operators run structured storage tenders — including parts of North America, Australia, the Middle East, India and Northern Europe — generate demand for containerised and rack-based energy storage battery systems rather than consumer formats. Volume here is lumpy: a single award can exceed the annual residential demand of a small country. That makes contract flexibility, not unit price, the decisive sourcing criterion.
3. Manufacturing-capacity-led markets
China, South Korea and Japan remain central to global cell and pack supply, and the surrounding ecosystem sets the reference for price and availability worldwide. The more interesting development for buyers is the build-out of capacity outside these markets, supported in several jurisdictions by local-content conditions and industrial incentives. This shifts the sourcing question from "where are cells made" to "where can packs be assembled and certified close to the end market."
4. Grid-reliability-led markets
Where grid reliability is uneven, demand is driven less by subsidy than by substitution: households and businesses buying backup because the alternative is downtime. These markets absorb solar battery backup configurations, lower-voltage packs and telecom or light-commercial systems. Price sensitivity is high, technical requirements are comparatively standardised, and distribution relationships matter more than brand recognition.
5. Export-hub and trade-route markets
A final category is defined less by internal demand than by its position in trade flows — markets used as assembly, re-export or regional distribution bases. For buyers, these archetypes are primarily a tariff and logistics question. They also raise compliance complexity, because goods assembled in one jurisdiction and sold into another may face two conformity regimes.
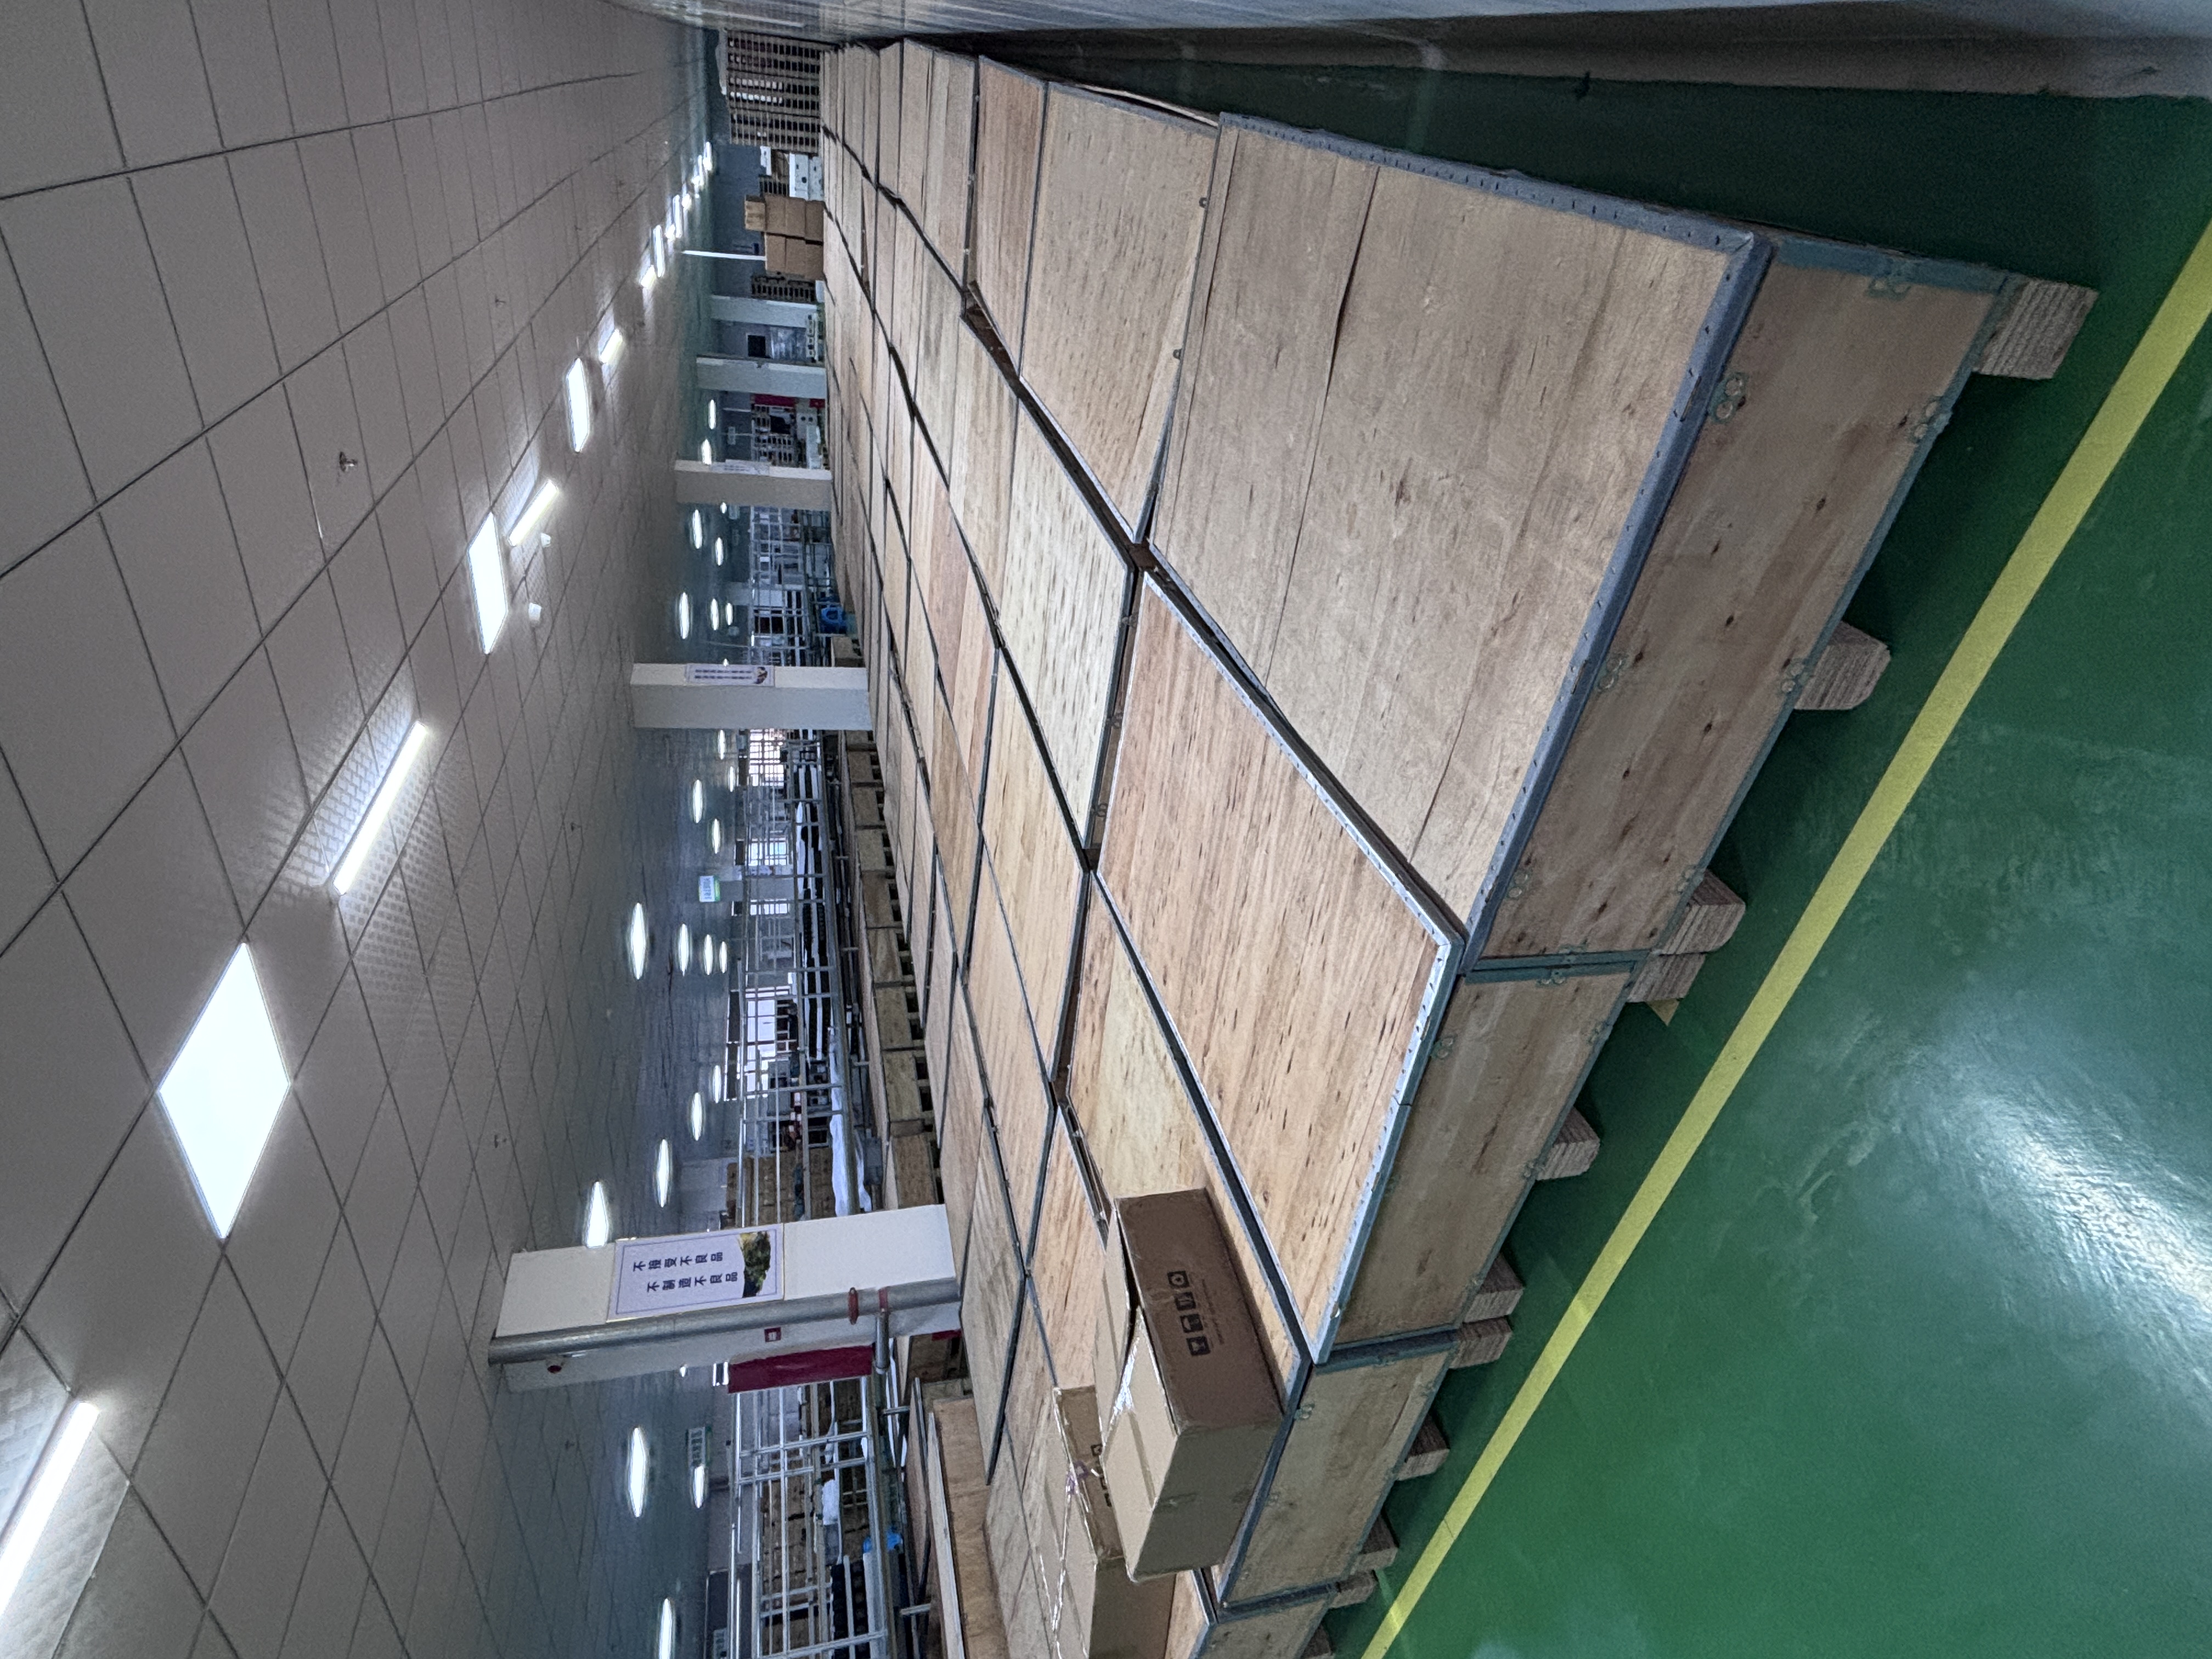
Regional supply planning depends on verified pack-level output, not on announced capacity. Image: Shenzhen Topway New Energy Co., Ltd. (HCC).
What Regional Divergence Does to Demand Categories
The practical consequence of divergence is that specific formats stop being interchangeable across markets. Four product categories illustrate the mechanism clearly.
| Market profile | Dominant demand categories | Sourcing implication |
|---|---|---|
| High retail electricity cost, mature rooftop PV | Wall mounted 48V lithium batteries, 5kW wall mounted battery, solar battery packs | Compact form factor and certification scope outweigh unit price |
| Utility-scale tender, weak local manufacturing | Energy storage battery systems, high-capacity 200Ah lithium battery modules | Contract flexibility, delivery reliability and BMS validation dominate |
| Uneven grid reliability, price-sensitive households | Solar battery backup, 12V 100Ah battery, 24V lithium ion battery, lithium solar batteries | Serviceability and replacement cost matter more than peak specification |
| Leisure, light mobility and light commercial | Golf cart battery, 36V battery, 48V lithium ion battery | Cycle-life claims must be validated against real duty cycles |
Two categories deserve specific attention because they sit at opposite ends of the market-signal spectrum. Wall-mounted 48V formats and solar battery packs are the most sensitive to residential policy design, because their payback depends directly on how self-consumption is valued. High-capacity 200Ah lithium batteries and full energy storage battery systems are the most sensitive to utility procurement cycles, because their volumes are set by awards rather than by household decisions. A supplier that can serve both is not automatically stronger — it simply carries a different risk profile.
How Supplier Capacity Fits Into a Market Shortlist
A market shortlist is only useful if there is a supplier able to execute against it. Shenzhen Topway New Energy Co., Ltd. (HCC) is a Shenzhen-based battery company founded in 2022, operating with a 10,000 m² facility, approximately 200 employees, a 15-person R&D team and a stated annual output figure of 1,200,000 units. Its stated export ratio is 40%, with customers recorded across the United States, the European Union, the United Kingdom, France, Germany, Italy, Spain, Russia, Poland, Turkey, Japan, Korea, Vietnam, Malaysia, Singapore, Indonesia, the Philippines, Canada, Mexico, Australia, Thailand, New Zealand, Brazil, Argentina, Chile and Peru.
That footprint is relevant to the shortlist not because coverage is itself a benefit, but because the diversity of listed markets implies exposure to several of the archetypes above simultaneously — residential retrofit, tender-driven and reliability-driven demand — each of which imposes different specification and documentation expectations on the same supplier. HCC states that its products have passed RoHS, UL and CE and other export certifications, which addresses the baseline conformity layer that cross-border buyers screen for first.
The company's stated business model is also directly relevant to capacity risk. HCC has operated through battery pack solutions and cooperative production and is transitioning toward in-house production following its own solution design, with advanced battery production lines planned. For buyers, that trajectory is worth reading carefully: it points to growing control over pack-level quality and delivery, while also indicating a capacity ramp that is still in progress.
Technical Explanation: Why Chemistry and Format Choices Travel Differently
Market signals determine what demand looks like; chemistry determines whether a supplier can serve it profitably. The comparison between lithium iron phosphate (LiFePO4) storage and sodium battery energy storage illustrates where the trade-offs actually sit, based on published performance comparisons between the two approaches.
| Attribute | Lithium (LiFePO4) energy storage | Sodium battery energy storage |
|---|---|---|
| Energy density, cycle life, charge-discharge efficiency | 50%, 50% and 4.3% higher respectively | Lower across all three metrics |
| Total energy in the same volume | 33.3% higher | Lower |
| Cycle life | 3,000 cycles | 2,000 cycles |
| 10-year replacement cost | 30% lower | Higher |
| Footprint and weight (comparable energy) | Approximately 45 L, about 50 kg | Approximately 60 L, about 65 kg |
| Maintenance cost and frequency | 20% lower; 1–2 inspections per year | Higher; more frequent intervention |
The underlying structural reason is industrial maturity. The LiFePO4 supply chain is complete and its product consistency and reliability have been verified at scale, which is why a 100Ah pack can be specified to sustain a 5kW load for one hour with roughly 30% stronger endurance than an equivalent sodium configuration. Sodium-ion, by contrast, is still in an earlier phase of scale verification — a gap that markets with demanding duty cycles will notice before markets optimising purely for cost.
Format choice adds a second variable. Wall-mounted and rack configurations share cell-level chemistry but differ in thermal management and serviceability, which is why the same chemistry performs differently in a residential retrofit and a utility tender.
Failure modes that cross borders
Over-discharge is one of the few risks that behaves identically in every market, because it is a function of control architecture rather than of local policy. Practical mitigation combines active cell balancing, over-temperature protection and current limiting at the control layer, with hardware measures including NTC temperature sensors, flame-retardant electrolyte or separator materials and a heat-insulating compartment. At the manufacturing stage, the corresponding measures are cell capacity grading and matching, followed by pack-stage high-temperature aging testing. Buyers evaluating suppliers across multiple markets should treat these process steps as a fixed requirement, not a regional variable.
Comparison With Traditional Solutions — and Where This Framework Breaks Down
Against traditional lead-acid storage, LiFePO4 and sodium-ion systems are generally positioned on lifetime economics rather than upfront price. Lead-acid retains an advantage in initial purchase cost in price-sensitive backup applications, and that advantage is genuine in low-duty-cycle use. The trade-off is weight for the same usable energy and more frequent replacement, which is why lead-acid typically persists where duty cycles are shallow and replacement labour is cheap. A direct cost comparison depends heavily on application duty cycle, so buyers should model it rather than assume it.
The market-signal framework itself has clear boundaries, and three of them matter:
- Market size estimates are not stable enough to anchor a decision. Published 2026 BESS figures range from approximately USD 17.4 billion (Grand View Research, specific focus on BESS systems) to USD 89.89 billion (Mordor Intelligence, including utility-scale projects). Different scope definitions produce differences of several multiples, so a shortlist built on headline size alone is fragile.
- Policy signals can reverse faster than supply chains. Incentive schemes and local-content conditions are administrative instruments, and a change in their design can reshape a market's demand profile within a single procurement cycle.
- Local capacity announcements are not output. Even where manufacturing build-out is genuine, ramp timing is uncertain, and buyers with committed delivery dates should verify current output rather than projected capacity.
Future Outlook: What the Next Two to Three Years Likely Reward
Three trajectories are supported by the available evidence. Storage demand continues to concentrate around policy-supported and reliability-driven archetypes rather than spreading uniformly, with the overall BESS market moving from roughly USD 13.2 billion in 2025 toward USD 99.7 billion by 2033 on Grand View Research's projection.
Chemistry diversification is the second trajectory. Lithium-ion's 53.5% share of the 2025 BESS industry establishes it as the incumbent, while sodium-ion is projected to expand at an 18.84% CAGR from 2026 to 2035, reaching USD 7.81 billion (Precedence Research). That does not imply replacement; it implies a split in which lithium holds high-duty-cycle and space-constrained applications while sodium absorbs cost-sensitive segments.
The third trajectory is format-level specialisation. The global golf cart battery market was estimated at USD 1.49 billion in 2024, with lithium-ion types capturing a 47.18% share (Mordor Intelligence / Strategic Market Research) — an example of a narrow application where lithium adoption has already passed the halfway point. Similar transitions in residential and light-commercial categories should be expected to follow the same pattern: gradual, category by category, rather than uniform.
On the regulatory side, the reference points are already reasonably settled and are unlikely to loosen. IEC 62619:2022 governs safety for lithium-ion batteries in industrial and stationary applications, including thermal runaway behaviour and BMS verification. UL 1973 remains the primary North American safety standard for stationary applications such as solar energy storage and UPS. UN 38.3 applies to the transport of lithium batteries globally, requiring eight specific tests including altitude simulation and thermal testing. For any market on a shortlist, these three determine whether a shipment is legally movable before it determines whether it is competitive.
FAQ
Which national markets belong on a storage battery buyer's shortlist for the next two to three years?
The most defensible shortlist is organised by archetype rather than by country size. Policy-led residential retrofit markets generate demand for wall-mounted and solar battery pack formats; utility tender markets generate demand for rack-based energy storage battery systems and high-capacity modules; grid-reliability markets generate demand for lower-voltage backup configurations; and export-hub markets matter primarily for tariff and logistics positioning. A country can belong to more than one archetype, and its position in each determines which product category is actually sellable there.
How do policy incentives translate into specific battery requirements?
Incentive design determines duty cycle, and duty cycle determines specification. Where compensation rewards self-consumption, demand concentrates on compact wall-mounted formats and solar battery packs sized to household consumption. Where compensation rewards capacity availability or duration, demand shifts to larger energy storage battery systems with stronger BMS validation. In both cases, the applicable conformity framework — such as IEC 62619:2022 for industrial and stationary lithium-ion applications, or UL 1973 in North America — sets the minimum bar the product must clear before commercial terms are relevant.
What does manufacturing capacity build-out in a region change for buyers?
Regional capacity build-out mainly reduces freight exposure and shortens lead times, but it rarely removes dependence on upstream cell supply, since pack assembly and cell production are distinct stages. Capacity announcements should therefore be treated as directional rather than binding. The integration layer is already concentrated — Tesla held a 15% share of the global BESS integrator market in 2024, with Sungrow at 14% (Wood Mackenzie) — which means regional pack assembly often sits downstream of a small number of upstream suppliers. Buyers should verify current output, not projected capacity, when committing to delivery schedules.
How do lithium and sodium-ion options compare for cross-border sourcing?
Published comparisons put lithium (LiFePO4) energy storage ahead on energy density, cycle life and charge-discharge efficiency by 50%, 50% and 4.3% respectively, with 33.3% more total energy in the same volume. Cycle life is 3,000 cycles against 2,000 for sodium, and the resulting 10-year replacement cost is 30% lower, with maintenance cost 20% lower and only one to two inspections required per year. A comparable configuration occupies roughly 45 L and about 50 kg against 60 L and about 65 kg for sodium, and a 100Ah pack sustains a 5kW load for one hour with approximately 30% stronger endurance. Sodium-ion remains attractive where cost structure or material availability dominates, and is projected to expand at an 18.84% CAGR from 2026 to 2035, reaching USD 7.81 billion (Precedence Research).
What are the limits of a market-signal-based sourcing decision?
Three limits apply. First, market size estimates diverge substantially by scope definition — 2026 BESS figures range from about USD 17.4 billion (Grand View Research) to USD 89.89 billion (Mordor Intelligence) — so headline numbers cannot anchor a decision alone. Second, policy instruments can be redesigned within a single procurement cycle, which changes demand profiles faster than supply chains can adapt. Third, certification and transport rules, including UN 38.3 for lithium battery transport, apply regardless of how favourable a market's demand signals appear, and must be resolved before commercial planning rather than after.
Closing Perspective
The markets that will matter most over the next two to three years are not the ones with the loudest targets, but the ones where policy, procurement obligation, verified capacity and trade rules line up at the same time. Buyers who shortlist on that basis — and who treat chemistry, format and certification as downstream filters rather than starting points — are better positioned than those reacting to headline market size. A detailed overview of the storage battery portfolio and export documentation reference is available in the company brochure.